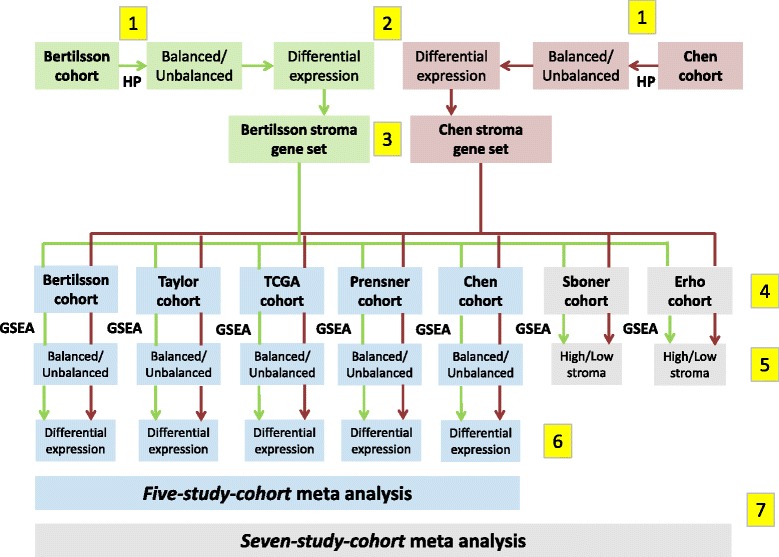
Fig. 1.

Flow chart illustrating the different computational steps for the analysis performed in this study. 1) Histopathology (HP) is used to create balanced and unbalanced datasets independently for the Bertilsson (marked green) and Chen (marked red) cohorts. 2) Differentially expressed genes for the HP-based balanced and unbalanced datasets are calculated for the Bertilsson and Chen cohorts. 3) Two stroma gene-sets are identified independently based on gene p-value relationships between the HP-based balanced and unbalanced datasets in the Bertilsson and Chen cohorts, respectively. 4) Gene Set Enrichment Analysis (GSEA) scores for all samples in all seven cohorts are calculated based on the two stroma gene-sets. These gene-sets are not combined, ensuring two independent GSEA stroma predictions for each sample in each cohort. 5) The GSEA scores are used to separate the five cohorts with both cancer and normal samples (including the cohorts from Bertilsson and Chen) into balanced and unbalanced datasets. The two remaining cohorts (Sboner and Erho) are only separated into groups with high and low stroma content. 6) Differentially expressed genes are calculated individually for the five cohorts with both cancer and normal samples. 7) Balanced and unbalanced datasets from the five-study-cohort are merged into one meta-analysis for differential expression. Balanced and unbalanced datasets from the five-study-cohort, as well as high and low stroma datasets from the Sboner and Erho cohorts are merged into one meta-analysis of the seven-study-cohort
