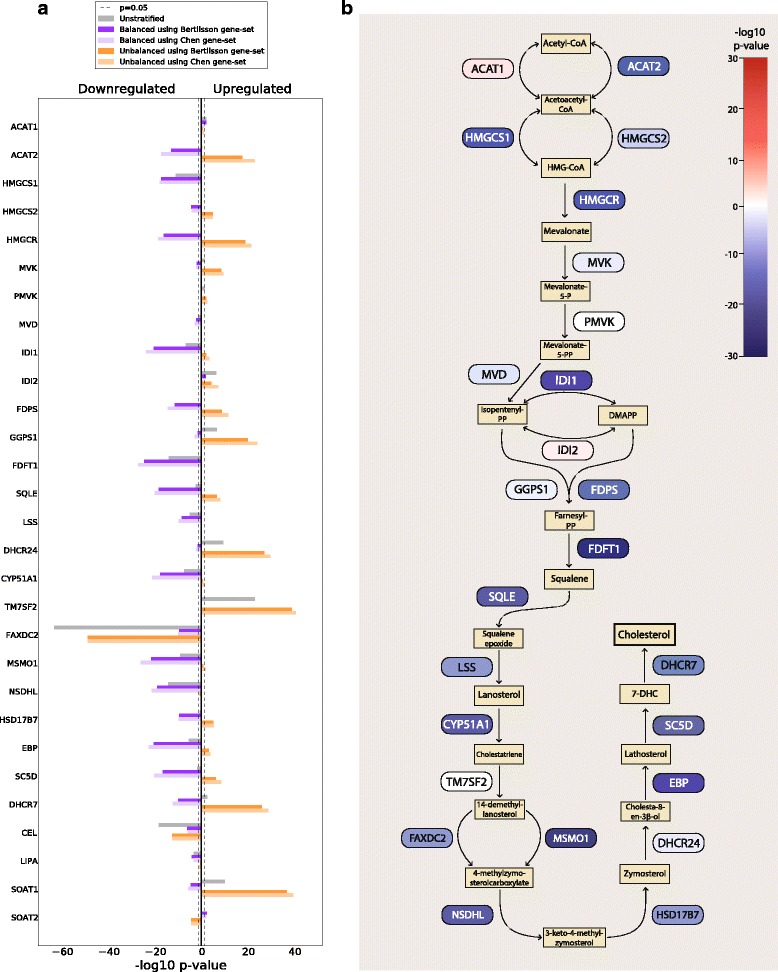
Fig. 3.

Genes in cholesterol synthesis pathway are coherently downregulated in prostate cancer compared to normal epithelium. a The figure shows –log10 p-values multiplied by 1 for upregulated genes, and − 1 for downregulated genes. The results presented are for a rank-based meta-analysis of the five-study-cohort. All p-values presented are corrected for multiple testing using the total number of 25,964 unique gene identifiers from all cohorts. Results from individual cohorts as well as the seven-study-cohort can be found in Additional file 1: Figure S4. b The schematic representation shows the cholesterol synthesis pathway with down- and upregulated genes color-coded in blue and red, respectively. The strength of the color corresponds to the degree of down- or upregulation
