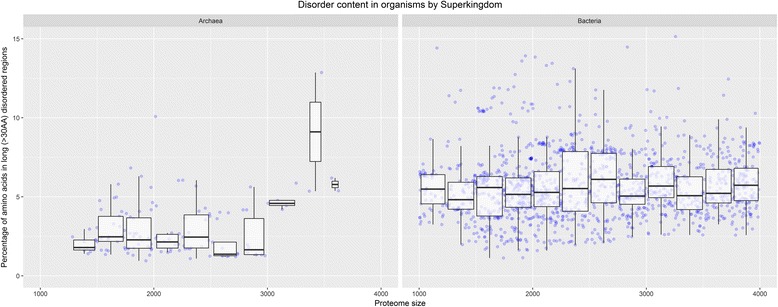
Fig. 2.

Disorder content in long (>30AA) disordered regions in Bacteria and Archaea with small proteomes. The disorder content represents the percentage of amino acids in long disordered regions, predicted by the IsUnstruct predictor. Since Archaea proteome size is in range of 1000 to 4000 proteins, only Bacteria in the same range are selected, in order to emphasize the difference in predicted disorder content between Bacteria and Archaea with similar proteome sizes. The box diagrams in the paper follow the usual representation: 1) the horizontal line inside a box represents the median value (50% of the samples is lower and 50% of the samples are higher than median); 2) lower box bound represents first quartile value (25% of data are lower and 75% are higher than first quartile); 3) upper box bound represents third quartile value (75% of data are lower and 25% are higher than third quartile); 4) the box height represents interquartile range (IQR); in the case of normal distribution, IQR = 1.35 x σ; 5) the whiskers (vertical lines above and under the box) ranges up to the highest datum within 1.5 x IQR of the upper quartile and down to the lowest datum within 1.5× IQR of the lower quartile; 6) the dots above the top whisker and under the bottom whisker represent outliers, i.e. the samples that are out of the range (in some of the diagrams each sample is represented as a dot, and outliers are not specifically highlighted, because it is obvious which samples lay out of the whiskers range); 7) in some of the diagrams the red dot represents the mean value
