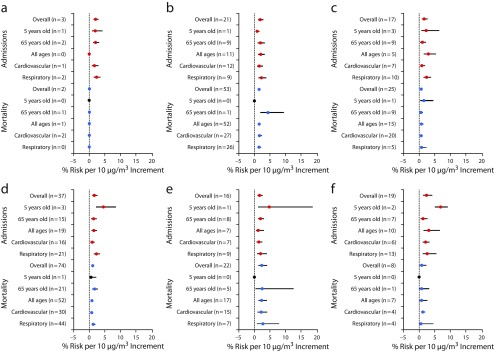
FIGURE 2—
Global Association Between Air Pollution and Health Stratified by Age, Health Outcome, and Diseases, for (a) Carbon Monoxide, (b) Nitrogen Dioxide, (c) Ozone, (d) PM10, (e) PM2.5, and (f) Sulphur Dioxide: Studies Published Between 2006 and May 11, 2016
Note. PM10 = fine particulate matter of ≤ 10 µm; PM2.5 = fine particulate matter of ≤ 2.5 µm. Because most of the studies reported results for more than 1 category of pollutant, health outcome, disease, or age, “n” here represents the number of reports, and not the number of studies. Red circle = hospital admissions; blue circle = mortality; black circle = there is no report; whiskers = 95% confidence interval.

