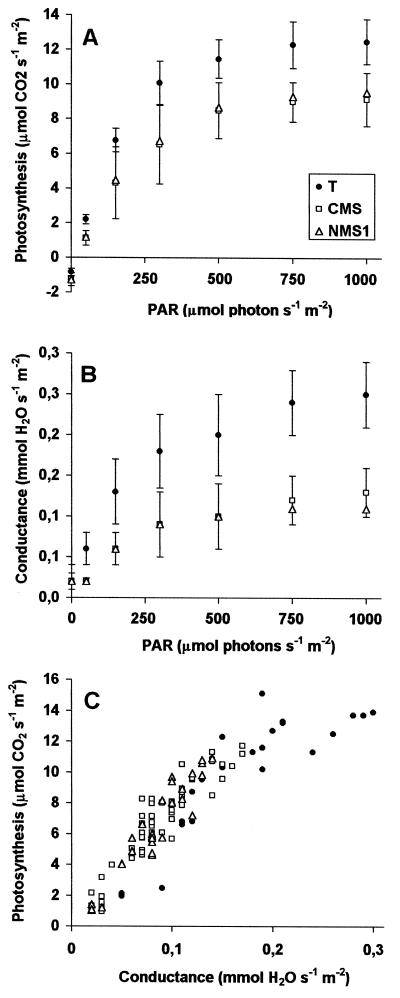
Figure 7.
Light-intensity curves of net photosynthesis (A), leaf conductance to water (B), and the correlation between the two (C). Means plus sd are given in A and B. For clarity of presentation, the sd of mutants were pooled together. For C, individual values are shown, from low to high illumination. Same conditions as for Figure 6.

