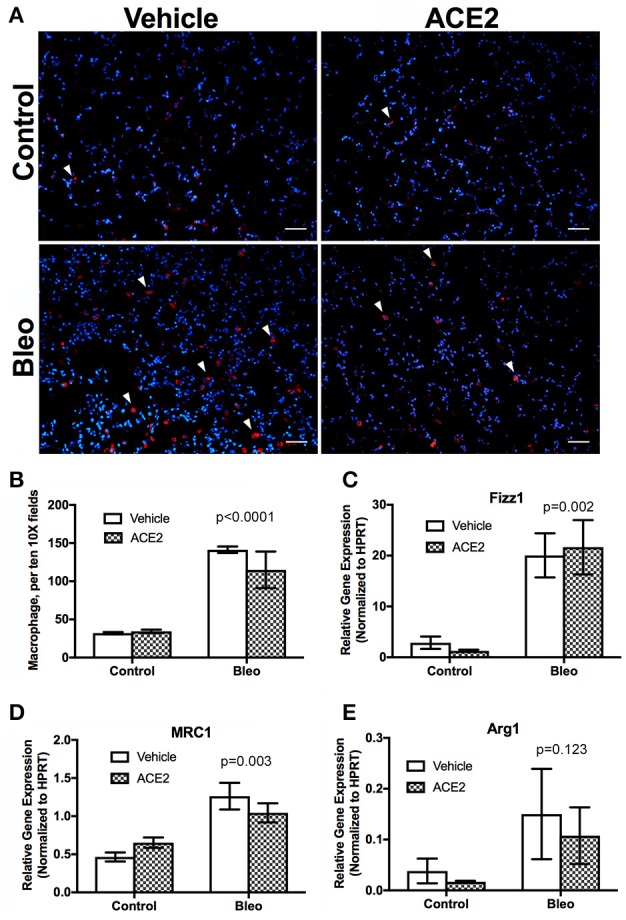
Figure 3.

Pulmonary macrophage dynamics in group 3 PH animals. Lung sections were stained for CD68 and random fields photographed at 10X and CD68+ cells counted (A,B, n = 4). RNA was isolated from frozen lungs and RT-PCR used to assess the expression of markers of macrophage polarization. (C) Retnla (Fizz1), (D) MRC1, (E) Arg1. Data presented in (C–E) are mean ± SEM, n = 4, 5, 6, and 6 for the control, ACE2, Bleo and Bleo+ACE2 groups respectively. Bleomycin-treated groups significantly differed from control groups by two-way ANOVA followed by Holm-Sidak's post-test, p < 0.0001 in (B–E). Scale bars shown are 50 microns.
