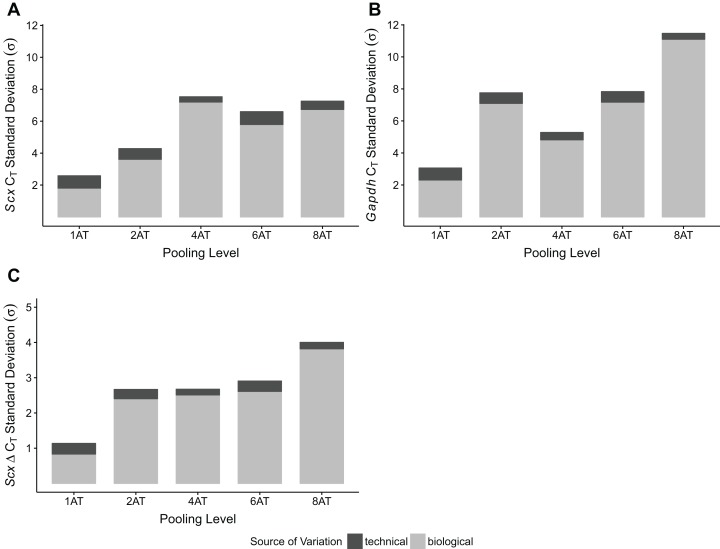
Figure 4. Sample pooling affects estimates of sample variance in RT-qPCR.
CT standard deviations for Scx (A) and Gapdh (B) measurements were calculated for the technical replicates (n = 3 repeat measurements; dark gray) and for biological replicates (n = 3 independent samples; light gray), separately. ΔCT was calculated by normalizing Scx CT values to Gapdh. Technical (dark gray) and biological (light gray) variance estimates were calculated separately (C). All measures (A–C) show that biological variance increases as number of individuals contributing to a pool increases.

