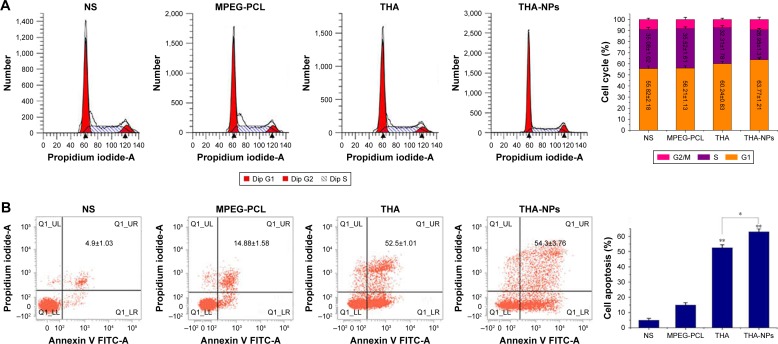
Figure 4.
Flow cytometric analysis of tumor tissue extracted from mice that received NS, MPEG-PCL, free THA, and THA-NPs.
Notes: (A) Quantitative analysis of the percentage of cells in G1, S, and G2/M phases in xenografts from mice in various group; (B) quantitative analysis of the percentage of apoptosis cells in various groups. *P<0.05 and **P<0.01.
Abbreviations: MPEG-PCL, methoxy poly(ethylene glycol)-poly(ε-caprolactone); NS, normal saline; THA, thalidomide; THA-NPs, nanoparticles loaded with thalidomide.

