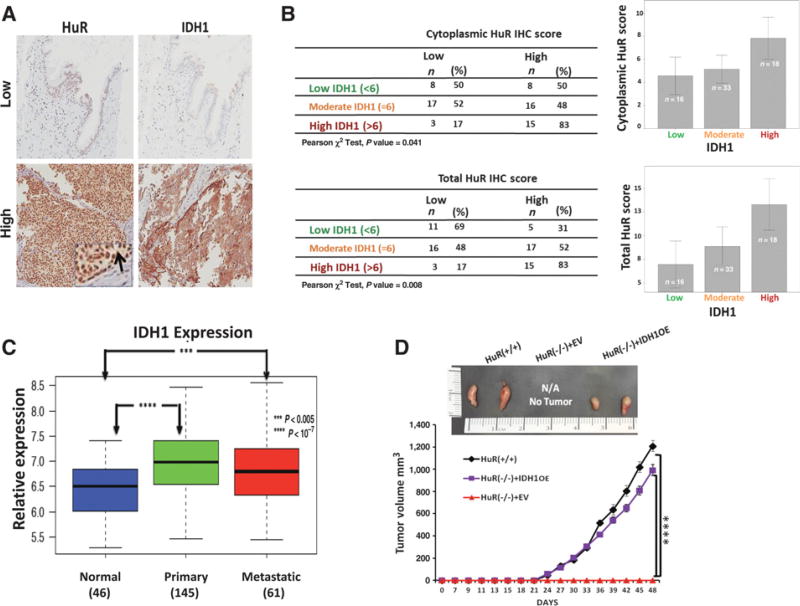
Figure 6. HuR is associated with IDH1 expression in clinical PDAC samples.
A, Immunohistochemistry of HuR and IDH1 in formalin-fixed, paraffin-embedded PDAC tumors. The inset and arrow indicate cytoplasmic HuR expression. B, Tabulation and graphing of IHC scores from the TMA dataset shows cytoplasmic and total HuR IHC scores to be associated with IDH1 scores. Spearman correlation test yielded a significant correlation between the scores (P = 0.33, P < 0.01). Error bars display 95% confidence interval. C, IDH1 mRNA expression levels in normal pancreatic tissue, primary PDAC, and metastatic PDAC. For each boxplot, median expression value, and first and third quartiles are indicated. ***, P < 0.005; ****, P < 0.0000001. D, Representative images of subcutaneous MiaPaca2 xenografts (day 48) along with tumor growth curves. Each data point represents the mean ± SEM (n= 8 per group; ****, P < 0.0001). See also Supplementary Fig. S8.

