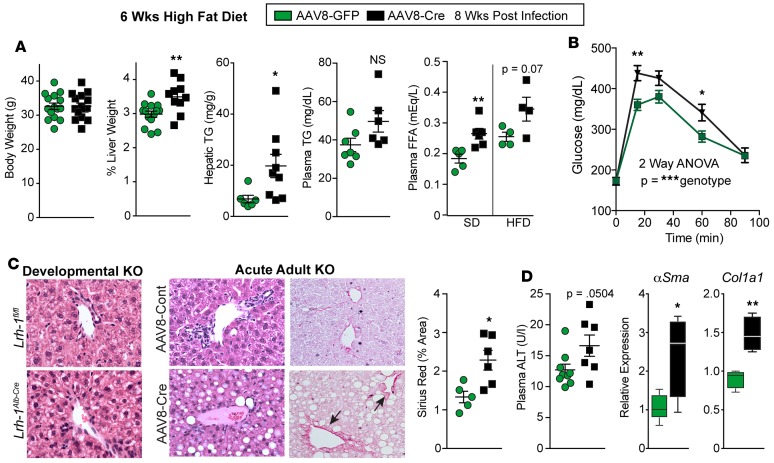
Figure 2. Lrh-1AAV8-Cre mice exhibit hepatic steatosis and liver injury after dietary challenge.
(A) Body weight, percentage liver weight, hepatic/plasma TG levels, and plasma free fatty acids (FFA) obtained for Lrh-1AAV8-GFP and Lrh-1AAV8-Cre male mice after 6 weeks of HFD. For body and liver weight, n = 15 and 13 per group; for plasma/hepatic TG, n = 7 and 9 per group; and for plasma FFA, n = 4 per group. Plasma FFA levels are also shown for mice fed SD (Lrh-1AAV8-GFP, n = 5, and Lrh-1AAV8-Cre, n = 6). (B) GTT (i.p.) for Lrh-1AAV8-GFP and Lrh-1AAV8-Cre mice after 6 weeks HFD challenge (Lrh-1AAV8-GFP, n = 12, and Lrh-1AAV8-Cre, n = 6 per group). (C) Representative images (original magnification, ×20) of H&E-stained liver sections from the developmental KO mice and controls (Lrh-1fl/fl and Lrh-1Alb-Cre) and adult acute KO mice and controls (Lrh-1AAV8-Cre and Lrh-1AAV8-GFP). All groups of mice were fed HFD. Sirius red staining and quantification are shown for adult KO mice, with arrows highlighting periportal collagen. (D) Plasma ALT and expression of αSma and Col1a1 in livers from Lrh-1AAV8-GFP and Lrh-1AAV8-Cre mice. For plasma ALT, n = 9 and 7 per group; for qPCR, n = 5 and 4 per group. Error bars represent ± SEM. For box-and-whisker plots, maximum and minimum values are shown with median. *P < 0.05, **P < 0.01, ***P < 0.001, unpaired Student’s t test (A, B, and D) and 2-way ANOVA with Sidak (C).

