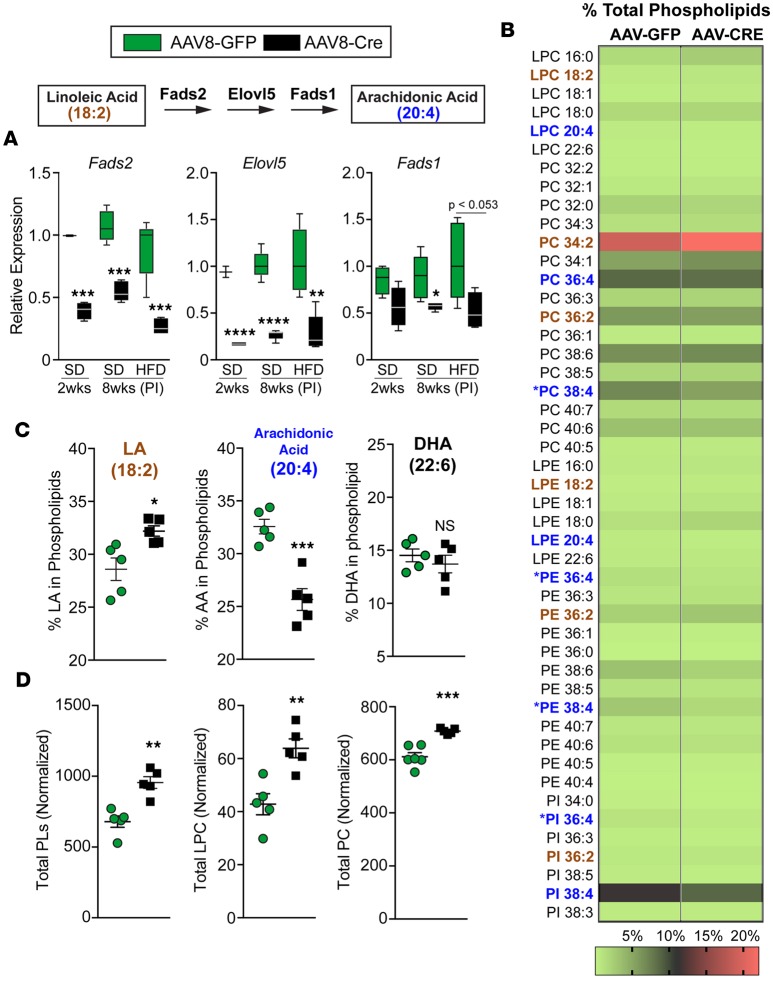
Figure 5. Loss of LRH-1 alters the phospholipid remodeling program and reduces hepatic arachidonic acid phospholipids.
(A) Schematic of the arachidonic acid biosynthetic pathway. Hepatic expression of Fads2, Elovl5, and Fads1 from Lrh-1AAV8-GFP and Lrh-1AAV8-Cre mice fed SD 2 weeks or 8 weeks after infection (PI) or fed HFD 8 weeks after infection. (B) Heatmap of lipidomics analysis of liver tissue from Lrh-1AAV8-GFP and Lrh-1AAV8-Cre male mice fed HFD for 6 weeks shown, with each lipid species depicted as a percentage of total phospholipids; the scale is shown at the bottom. Lipid species highlighted in brown represent linoleic acid phospholipids, and those highlighted in blue represent arachidonic acid phospholipid species. Substantially changed arachidonic acid species are indicated. (C) Percentages of phospholipid species containing arachidonic acid, linoleic acid (LA), or docosahexaenoic acid (DHA) in Lrh-1AAV8-GFP and Lrh-1AAV8-Cre livers. (D) Sum of total phospholipids (PL), lysophosphatidylcholine (LPC), and phosphatidylcholine (PC) (n = 5 per group). Error bars represent ± SEM. For box-and-whisker plots, maximum and minimum values are shown with median. *P < 0.05, **P < 0.01, ***P < 0.001, ****P < 0.0001, unpaired Student’s t test for A, C, and D.

