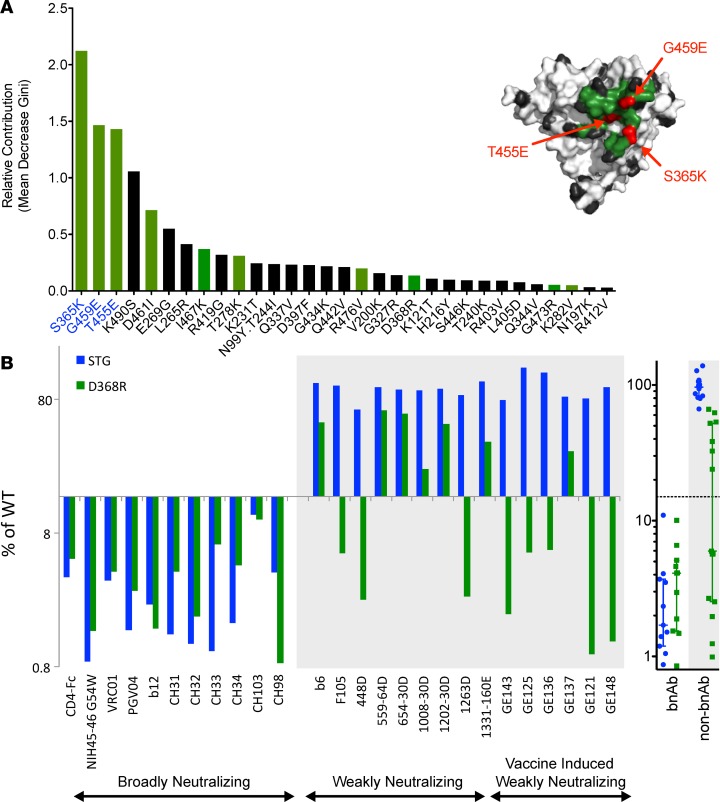
Figure 2. Classification of CD4bs mAb neutralization breadth.
(A) A random forest approach was used to classify mAb neutralization breadth using epitope maps. The relative importance of each point mutant to the classification models is presented in decreasing order, as ranked based on mean decrease in Gini index. CD4bs residues are colored in green, and other core residues are colored black. A structural model of the core, denoting the locations of the top 3 positions (S365, T455, G459) utilized by the classifier in red, is shown. (B) Benchmarking against D368R. The residues most important to the classifier were mutated to generate a triple mutant probe (STG). The binding of each CD4bs mAb (n = 26) relative to the WT gp120 core is presented for STG and the CD4bs probe D368R across individual mAbs and when grouped according to neutralization breadth. Data are represented as median and interquartile range.

