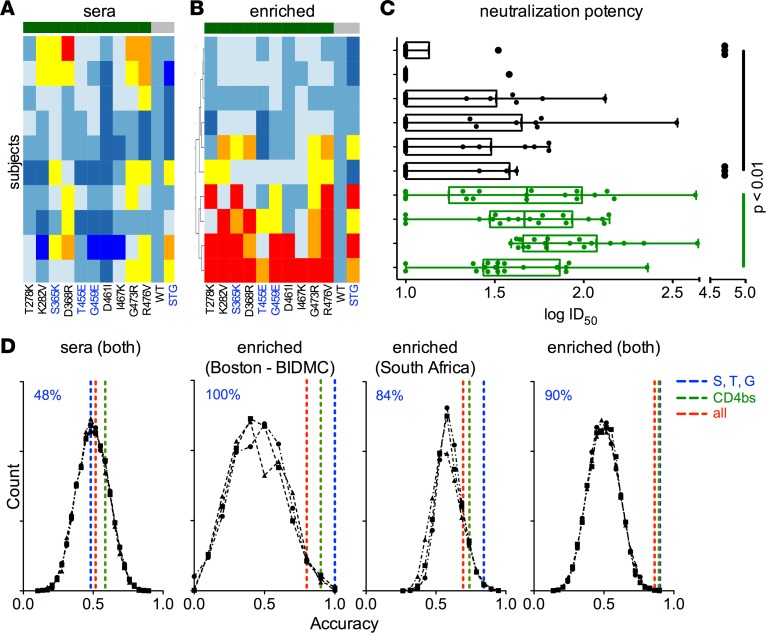
Figure 5. Prediction of polyclonal sera neutralization breadth across diverse subject cohorts.
Heatmap of the relative binding of sera before (A) and after (B) STG-based enrichment for a set of 10 samples from a second Boston area (BIDMC) cohort against CD4bs mutant cores (green), the WT core, and the triple mutant STG core (both in gray). (C) Neutralization potency (ID50) of the 10 sera samples across a panel of 18 tier 2 virus strains (each dot represents 1 unique virus strain) with subjects aligned as in A and B. Interquartile ranges and Tukey whiskers are shown; mean ID50 values across the virus panel for each subject were compared between the STG sensitive (green) and insensitive (black) group, with significance defined by Mann-Whitney test. (D) A classifier was trained to predict the neutralization breadth of polyclonal samples from HIV-infected subjects in the Boston area (BIDMC) cohort (n = 10), a South African cohort (n = 19), or both, based on epitope-mapping input of sera or the STG-enriched IgG fraction. Dashed lines represent classifier performance when the complete mutant panel (red), CD4bs residues only (green), or the S, T, and G positions alone (blue) were used in model training. Black lines represent classifier performance when permuted neutralization class assignments were predicted using the whole panel or CD4bs and S, T, and G mutant subsets. Classification accuracy of models learned from considering S, T, and G positions only are noted at the top left of each panel in blue.

