
Fig. 4.
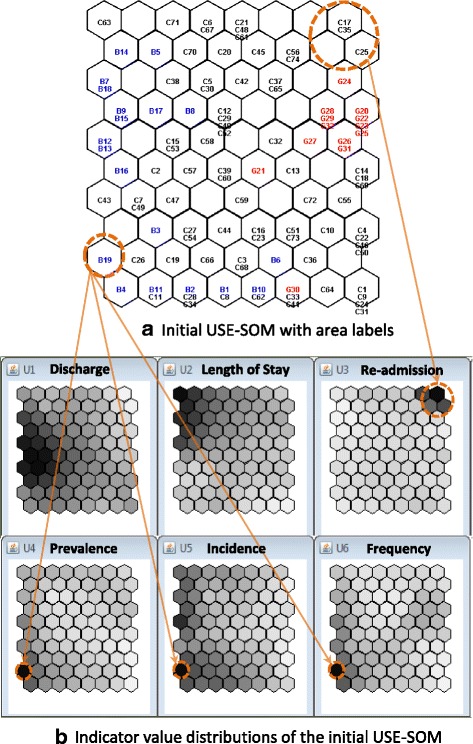
The visual identification of the system outliers in the initial USE-SOM. a The initial USE-SOM with the small mental health areas labelled (black, blue and red for Catalonia, Biscay and Gipuzkoa areas, respectively). The identified outlier areas are circled in orange. b The six indicator value planes of the USE-SOM showing the extreme values of the circled areas. The darker grey colour indicates the higher indicator value