
Fig. 6.
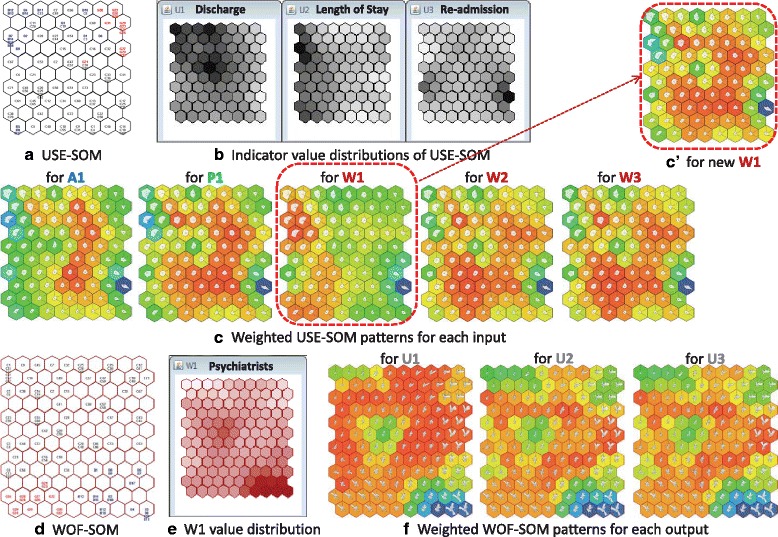
Visual analysis of the input and output indicator patterns by the SOMNet. a The output USE-SOM with areas. b The value planes of the output indicators, U1, U2 and U3. c The output pattern comparison using the input-driven analysis. d The input WOF-SOM with areas. e The value plane for the input indicator, W1. f The input pattern comparison using the output-driven analysis. c' The output USE-SOM pattern for the newly given W1 by the SOMNet analysis