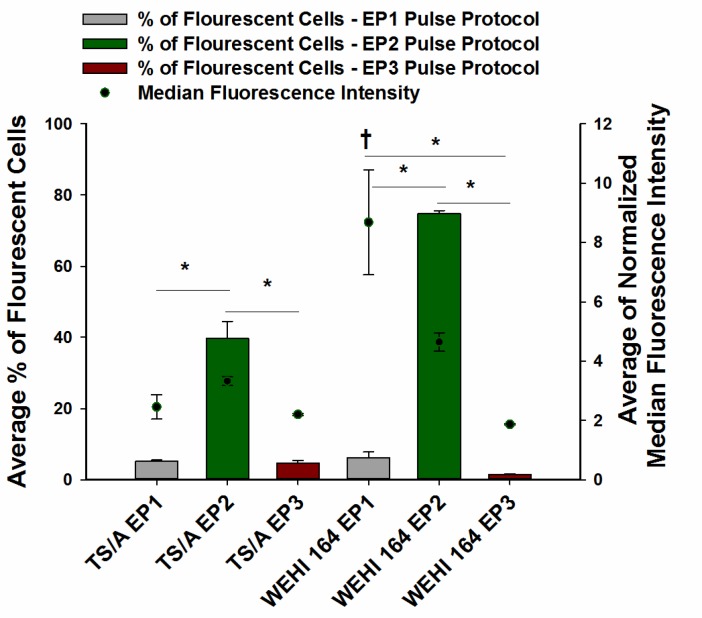
Figure 1. Transfection efficiency of TS/A and WEHI 164 cell lines after pEGFP-N1 electrotransfer using three different pulse protocols of DNA electrotransfer.
pEGFP-N1 was electrotransfered by delivery of eight 5 ms pulses with a voltage to distance ratio of 600 V/cm, frequency 1 Hz (EP1), six 100 µs pulses with a voltage to distance ratio of 1300 V/cm, frequency 4 Hz (EP2) or with combination of one 100 µs pulse with a voltage to distance ratio 600 V/cm and four 100 ms pulses with a voltage to distance ratio 80 V/cm, duration, frequency 1Hz (EP3) using plate electrode. *statistically significant difference of percentage of fluorescent cells between electrotransfer protocol groups (P < 0.05). †Statistically significant difference between the mean values of median fluorescence intensity of cells receiving the EP1 protocol and fluorescence intensity of cells receiving the EP2 and EP3 pulse protocols.

