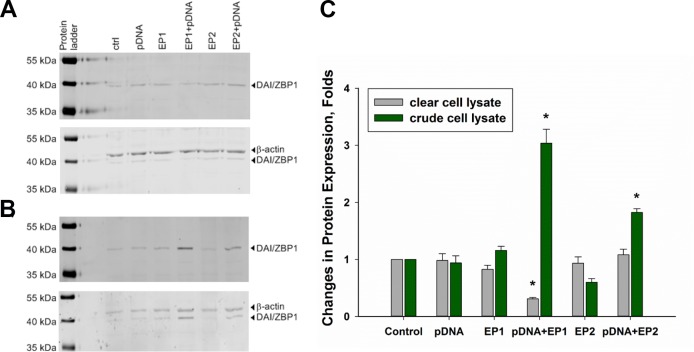
Figure 3. Changes in DAI/ZBP-1 expression in TS/A cells.
Panel (A) shows Western blot analysis of DAI/ZBP1 expression among different experimental groups when cell lysate was cleared by centrifugation, while panel (B) shows the analysis of crude cell lysate. Panel (C) represents the results of 3 independent experiments (mean ± standard error of the mean, n = 3; open bars represent clear lysate, filled ones represent crude lysate;**p < 0.01; *p < 0.05).

