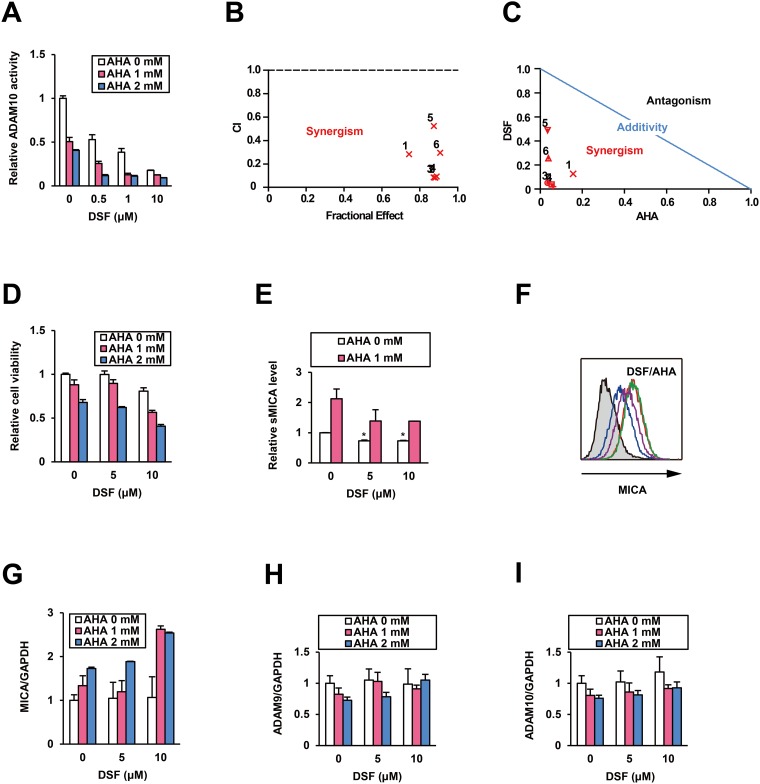
Figure 4. Combination treatment with DSF and AHA.
Effects of the combination treatment with DSF and AHA on ADAM10 (A) were tested in vitro, and synergism was evaluated by (B) CI and (C) normalized isobologram at the following ratios: 1) 0.5:1, 2) 0.5:2, 3) 1:1, 4) 1:2, 5) 10:1, and 6) 10:2 (DSF (μM):AHA (mM)). After the treatment of PLC/PRF/5 cells with DSF and AHA at the indicated doses for 48 h, (D) relative cell viability and (E) sMICA levels were measured. *P < 0.05 by the Welch t-test. (F) The mMICA levels in PLC/PRF/5 cells were examined by flow cytometry after no treatment (Blue), monotreatment with DSF (purple) or AHA (red), and cotreatment with DSF and AHA (green) for 72 h, with the isotype control displayed as a gray histogram. After cotreatment with DSF and AHA at the indicated doses for 48 h, relative mRNA levels of MICA (G), ADAM9 (H), and ADAM10 (I) were measured by qRT-PCR with normalization to GAPDH.

