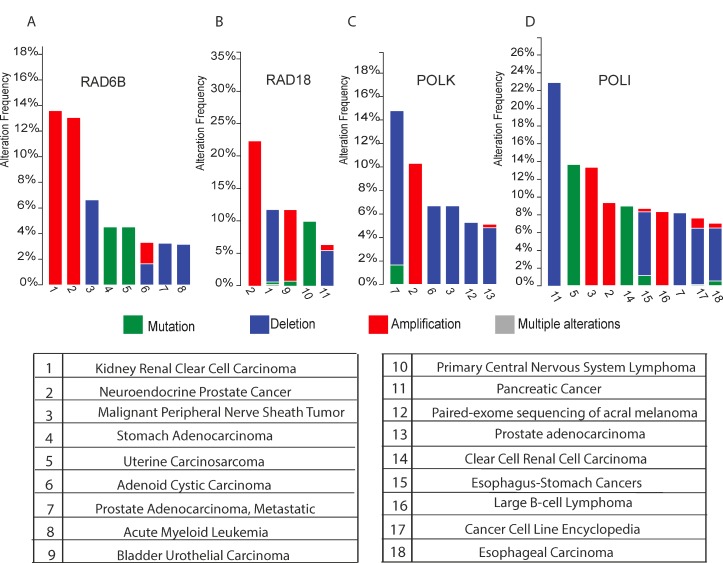
Figure 1.
(A–D) Histograms show the cross-cancer alteration frequency of indicated genes (RAD6B Figure 1A), (RAD18 Figure 1B), (POLK Figure 1C) and (POLI Figure 1D) for the indicated tumor types: 1 Kidney Renal Clear Cell Carcinoma (TCGA, Provisional); 2 Neuroendocrine Prostate Cancer (Trento/Cornell/Broad 2016); 3 Malignant Peripheral Nerve Sheath Tumor (MSKCC, Nat Genet 2014); 4 Stomach Adenocarcinoma (UHK, Nat Genet 2011); 5 Uterine Carcinosarcoma (Johns Hopkins University, Nat Commun 2014); 6 Adenoid Cystic Carcinoma (MSKCC, Nat Genet 2013); 7 Prostate Adenocarcinoma, Metastatic (Michigan, Nature 2012); 8 Acute Myeloid Leukemia (TCGA, Provisional); 9 Bladder Urothelial Carcinoma (TCGA, Nature 2014); 10 Primary Central Nervous System Lymphoma (Mayo Clinic, Clin Cancer Res 2015); 11 Pancreatic Cancer (UTSW, Nat Commun 2015); 12 Paired-exome sequencing of acral melanoma (TGEN, Genome Res 2017); 13 Prostate Adenocarcinoma (provisional); 14 Multiregion Sequencing of Clear Cell Renal Cell Carcinoma (IRC, Nat Genet 2014); 15 TCGA data for Esophagus-Stomach Cancers (TCGA, Nature 2017); 16 Lymphoid Neoplasm Diffuse Large B-cell Lymphoma (TCGA, Provisional); 17 Cancer Cell Line Encyclopedia (Novartis/Broad, Nature 2012); 18 Esophageal Carcinoma (TCGA, Provisional). The data were retrieved from cBioPortal [18, 17].

