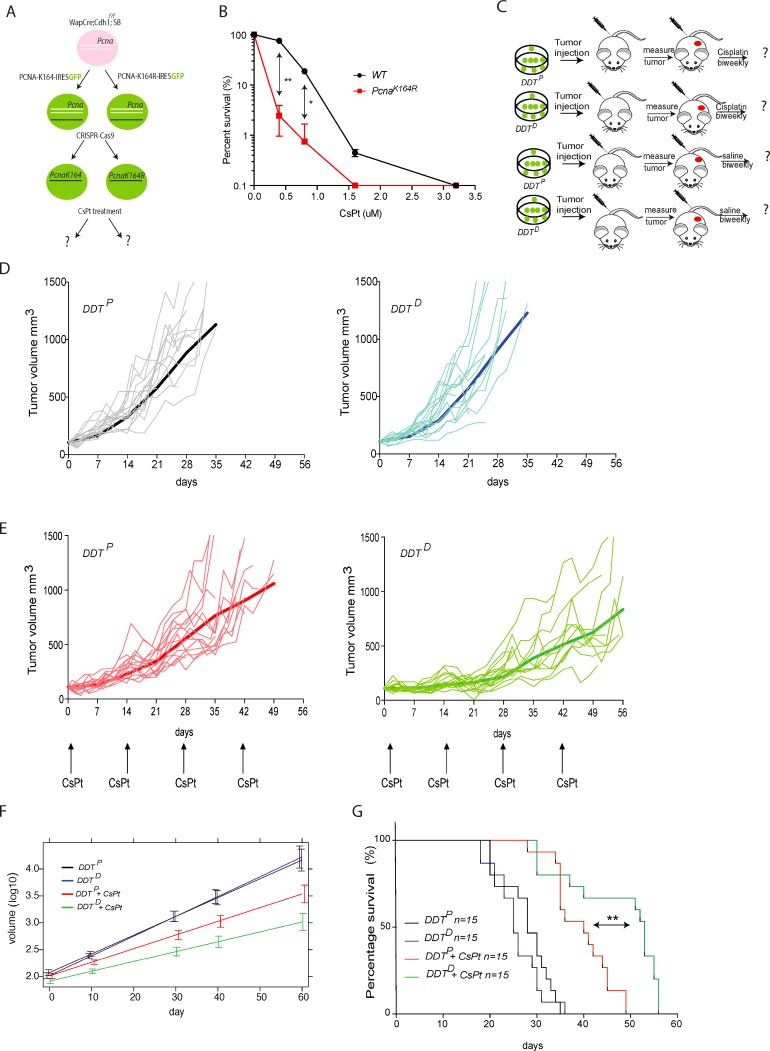
Figure 5. Assessing the chemosensitizing potential of a DDT blockade in mammary gland tumor model.
(A) Graphic representation of in vitro modification of mammary gland tumor cells to derive DDTP and DDTD invasive lobular breast carcinoma lines. (B) Cell survival in response to different concentration of CsPt. Mammary tumor cell survival was normalized to the mock-treated cells for each condition. Unpaired t test with Welch’s correction **P < 0.01; *P < 0.5 was used to check the significance. The average of two independent experiments with two independent cell lines per genotype is plotted ± SD. (C) Schematic representation of mammary gland tumor cells transplantation and follow-up. Wap–Cre;Cdh1F/F; SB;PcnaK164 (DDTP) and Wap–Cre;Cdh1F/F; SB;PcnaK146R (DDTD) tumor cells were transplanted in the fourth mammary fat pad of nude (NMRI) recipient mice. Tumor growth was monitored three times per week to assess treatment efficacy. Each experimental group contains 15 mice. (E) As in (D), but here mice where enrolled in the treatment schedule when tumors had reached a size of 100 mm3. Mice were treated with MTD 6 mg/kg CsPt every two weeks. (F) Colored curves represent the average trajectory in each group over time of the tumor volumes measured on a logarithmic scale according to a linear mixed-effect model fitted by REML. Comparison between treated DDTP and treated DDTD gives a p < 0.001. (G) Kaplan–Meier curve of treated vs non-treated tumor bearing mice of indicated genotype. **p = 0.0012 according to Mantel-Cox test, when comparing survival of mice with a DDTP or DDTD mammary gland tumor, upon 6 mg/kg CsPt treatment, administered every two weeks.

