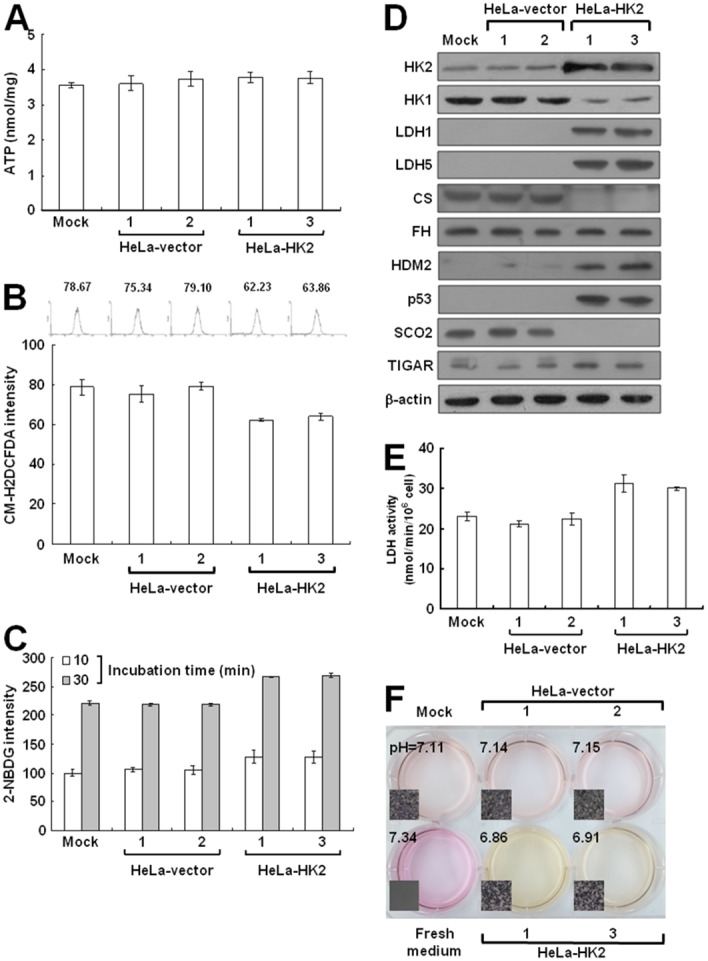
Figure 8. HK2 overproduction alters energetic metabolism.

(A) ATP assay of HK2-overexpressing cells. Total cell extracts prepared from cells as indicated were subjected to an ATP assay using the ATP Bioluminescence Assay Kit CLSII according to the manufacturer’s instructions. (B) ROS assay of HK2-overexpressing cells. Cells as indicated were stained with CM-H2DCFDA and then fluorescence intensities were inspected and analysed by a flow cytometer. (C) Glucose uptake assay of HK2-overproducing cells. Cells as indicated were treated with 2-NDBG and then fluorescence intensities were examined and analysed by a flow cytometer. (D) Western blotting of proteins participated in the TCA cycle and glycolysis in HK2-overexpressing cells. Total protein extracts prepared from cells as indicated were blotted with antibodies specific for proteins as labelled. The β-actin level serves as the loading control for total proteins. (E) Lactate dehydrogenase assay of HK2-overproducing cells. Cells as indicated were subjected to a lactate dehydrogenase activity assay using the Lactate Dehydrogenase Assay Kit according to the manufacturer’s procedures. (F) pH measurement in conditioned medium of HK2-overexpressing cells. Cells as indicated were cultured until confluent and then incubated in fresh medium. The color and pH value of the conditioned media were imaged and measured. The plotted data are averaged from three independent experiments and the bars represent mean ± SD.
