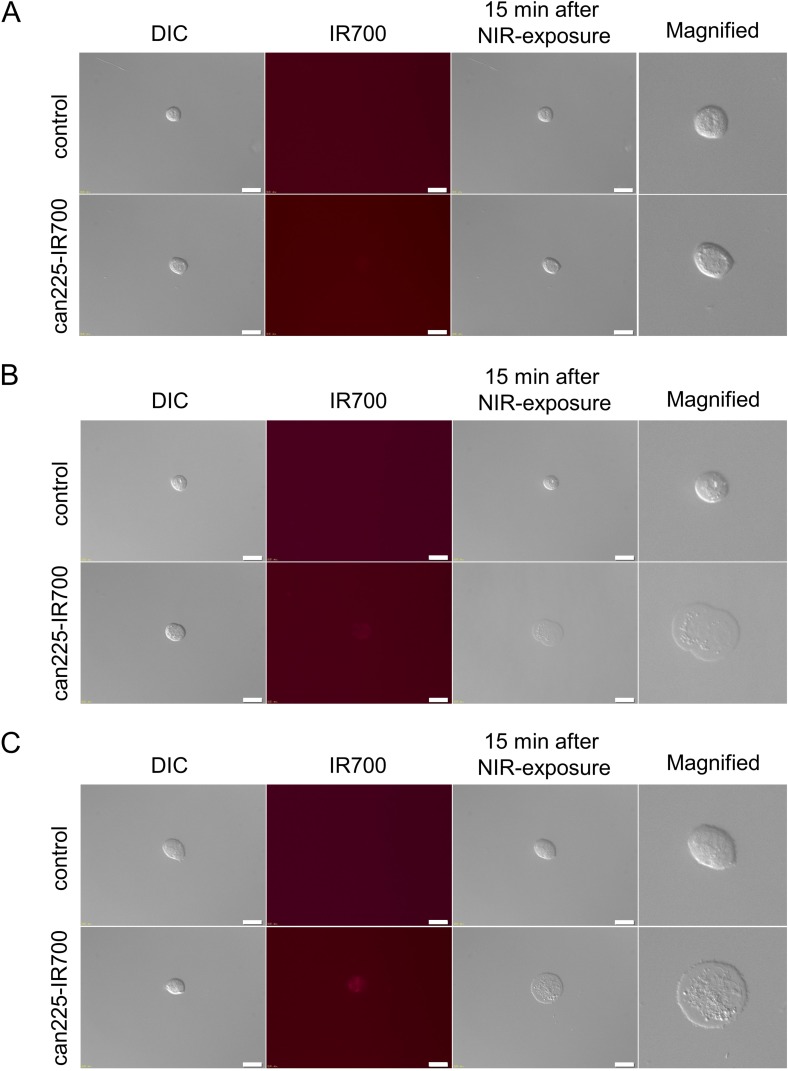
Figure 2. In vitro fluorescence microscopic images of three TCC cell lines.
(A) Differential interference contrast (DIC) and fluorescence images of TCC original cells after incubation with can225-IR700 for 6 h. Slight fluorescence signal was shown in TCC original cell. There was no cytotoxicity upon excitation with low dose NIR light (after 15 min) in TCC original cell. White scale bars = 20 µm. (B) DIC and fluorescence images of TCC AXA cells after incubation with can225-IR700 for 6 h. Intermediate fluorescence signal was shown in TCC AXA cell. Necrotic cell death was observed upon excitation with low dose NIR light (after 15 min) in TCC AXA cell. (C) DIC and fluorescence images of TCC SH cells after incubation with can225-IR700 for 6 h. High fluorescence signal was shown in TCC SH cell. Necrotic cell death was observed upon excitation with low dose of NIR light (after 15 min) in TCC SH cell.

