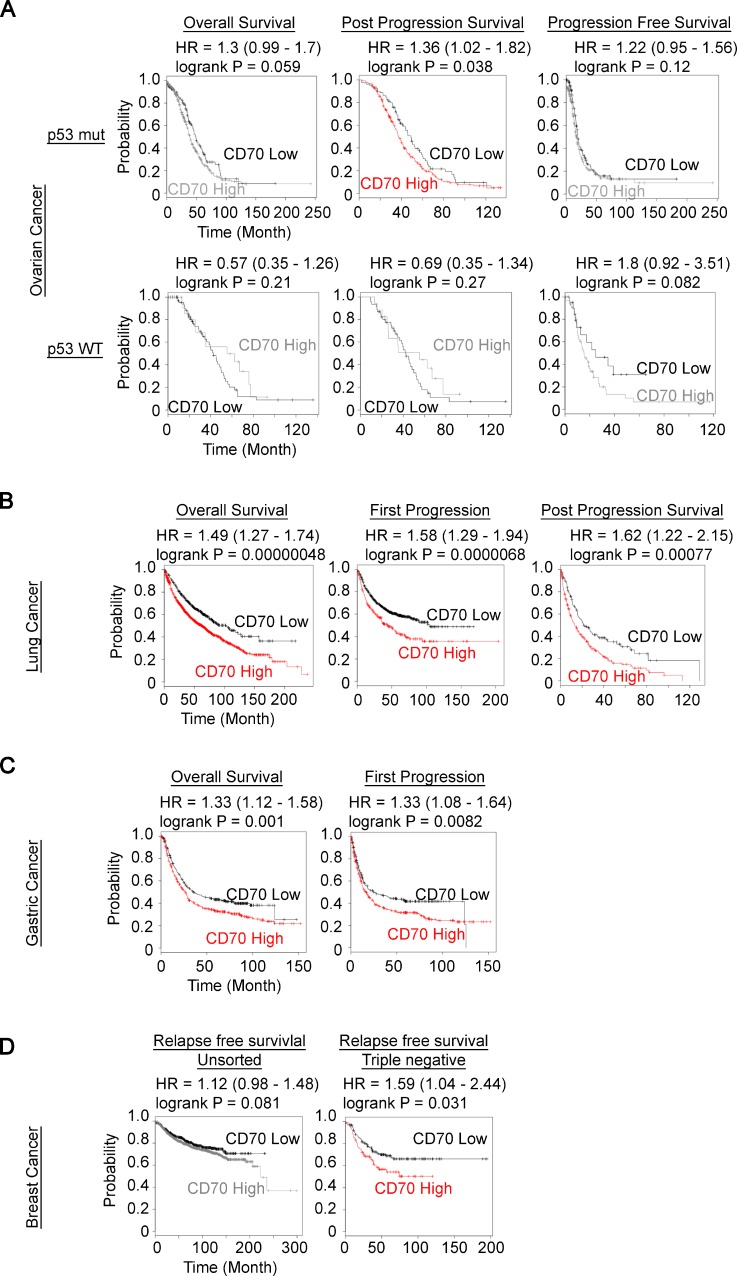
Figure 1. Prognostic value of CD70 expression in human cancer patient.
(A–D) Kaplan–Meier plots of CD70 expression in tumors with patient survival as indicated were generated using the KM plotter (kmplot.com). (A) ovarian cancer with wild-type (WT) or mutant (mut) p53 status. (B) lung cancer. (C) gastric cancer. (D) unsorted breast cancer (left) and triple negative (right) breast cancer. The colored plots show statistically significant differences between the groups.

