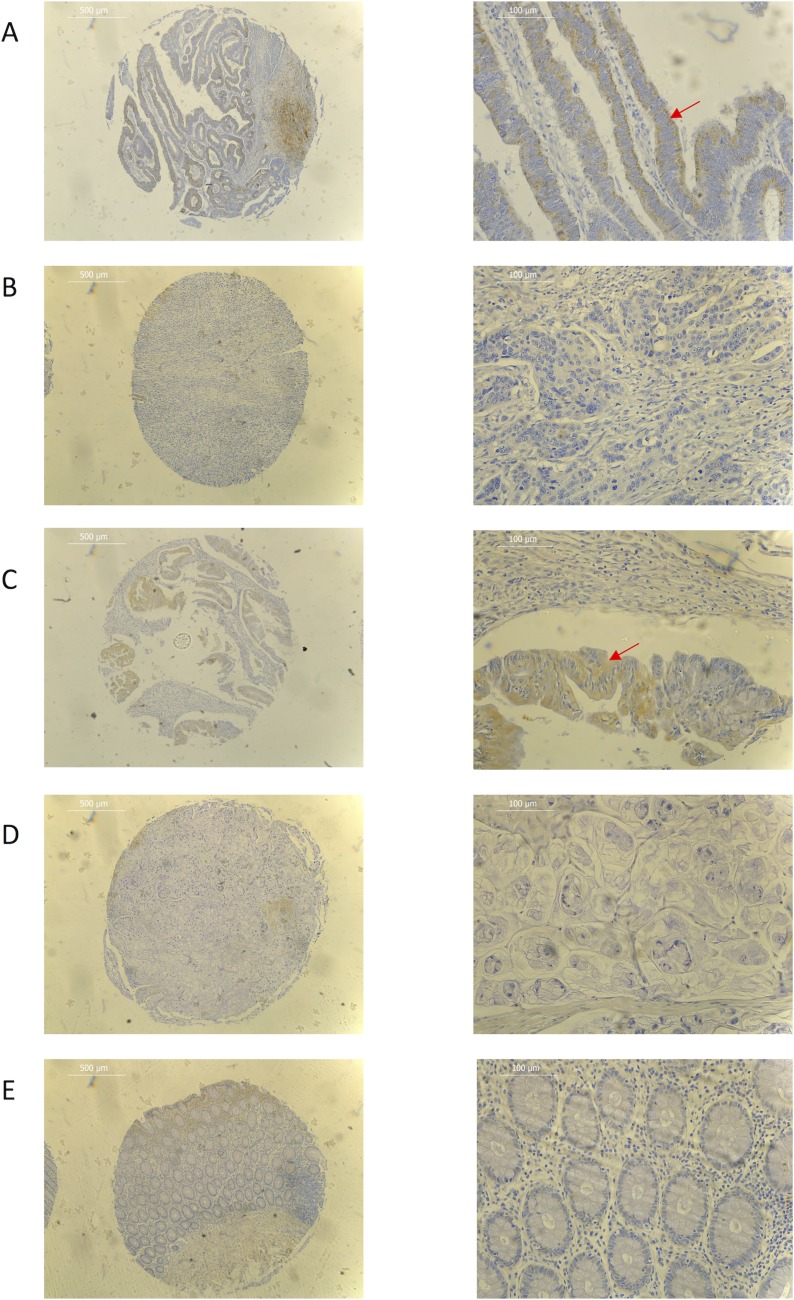
Figure 2.
Representative immunohistochemistry images for (A) well differentiated adenocarcinoma (B) poorly differentiated adenocarcinoma (C) well differentiated mucinous adenocarcinoma (D) poorly differentiated mucinous adenocarcinoma (E) normal colorectal tissue samples. Red arrow shows cytoplasmic tumour staining. ×40 (L) and ×200 (R) magnification used. Scale bar represents 500 µm (L) and 100 µm (R).

