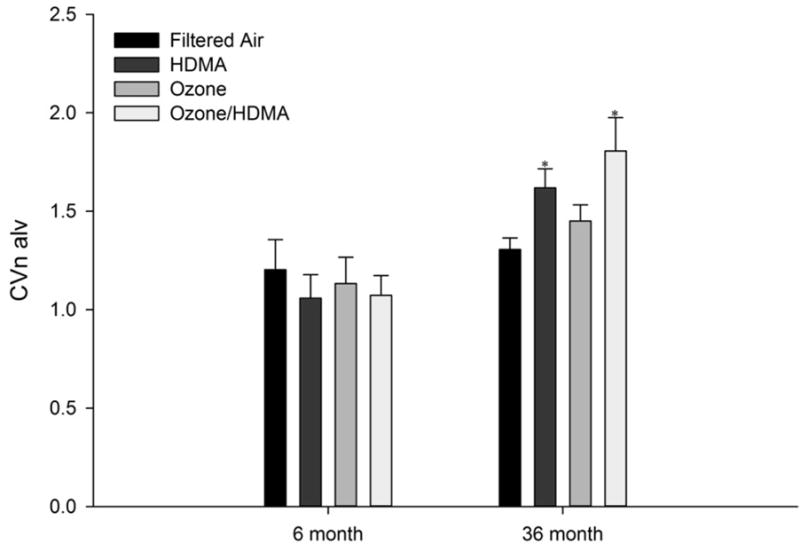
Figure 4.

Coefficient of variation of the distribution of mean number-weighted alveolar volumes vs. age (months) in all treatment groups for both 6 month exposure and 36 month exposure and recovery cohorts. There was a significant increase in the CVn alv in the HDMA and HDMA + O3 groups compared to the FA group in the 36 month exposure and recovery cohort. *Significant difference (P<0.05) from the FA control lobe.
