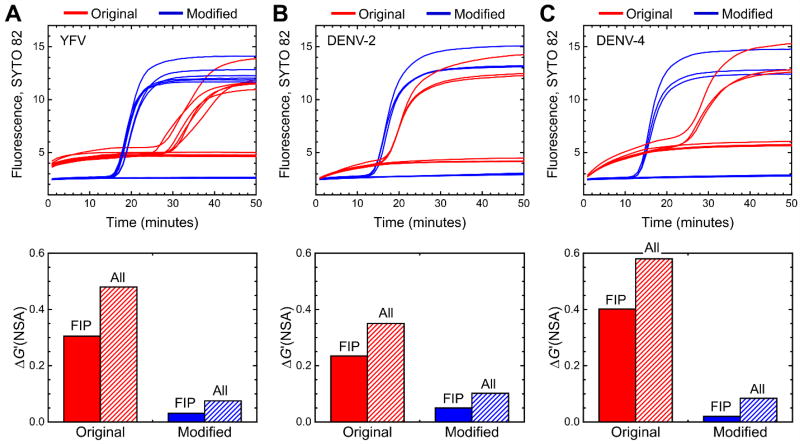
Figure 2.
Experimental real-time amplification curves showing the effect of FIP primer modifications to reduce the impact of primer dimer amplification for (A) YFV, (B) DENV2 and (C) DENV4. For each target, amplification curves are shown for the original primer set (red), or the primer set with modified FIP (blue). For each primer set, the experiments depict an equal number of no-template controls and positive controls, with the following amounts of viral RNA added as template. YFV: 7000 genome copies, n = 6; DENV2, 1100 genome copies, n = 3; DENV4, 1100 genome copies, n = 3. The graphs below the real-time curves show the Gibbs free energy change due to non-specific amplification (ΔG’(NSA)) for the original and modified primers, calculated considering either just the FIP primer (solid color bars) or all primers (hatched bars).

