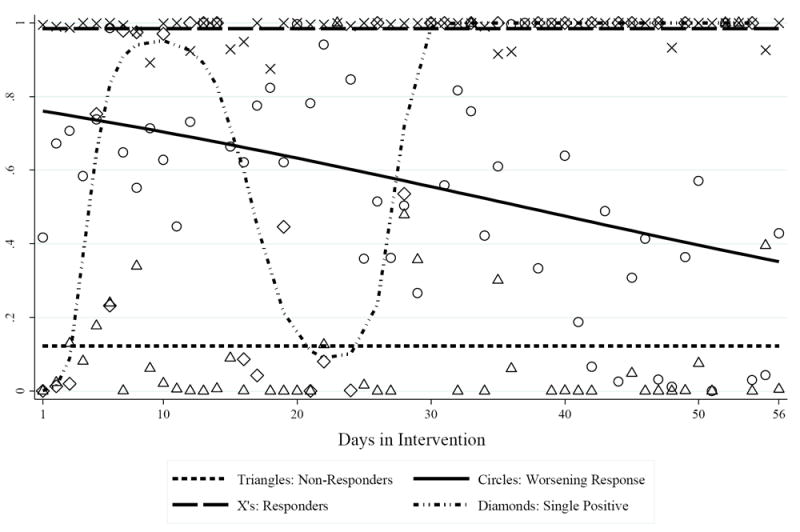
Figure 1.

Logistic Growth Trajectory Model Analysis (N = 119). Point estimates represent the calculated probability of providing a stimulant metabolite-free urine sample on a given day of the intervention (triangles = non-responders; circles = worsening response pattern; X’s = responders, diamonds = single-positive); trend lines represent the overall pattern of intervention response for each category (short dash = non-responders; solid = worsening response; long dash = responders; short dash dot dot = single positive).
