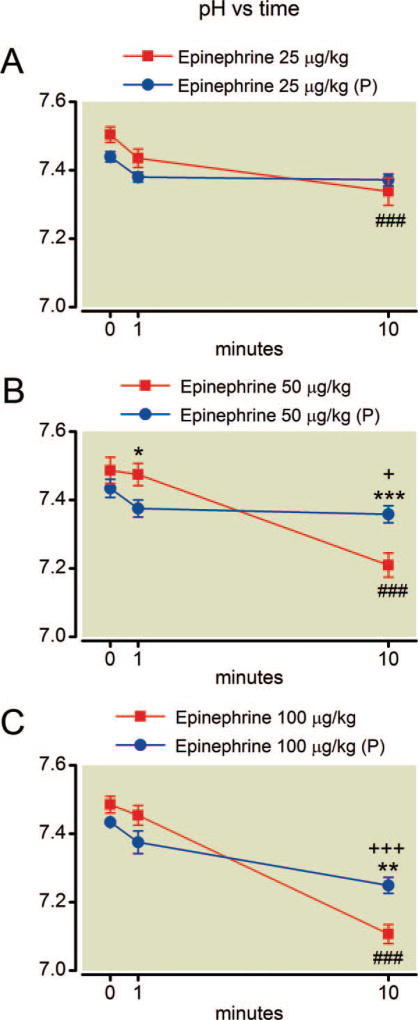
Fig. 4.
(A–C) Time course of arterial pH after epinephrine. Epinephrine treatment by itself alters pH by 10 min at all doses. Phentolamine pretreatment (P) is protective at all but the highest dose. Mean values are plotted with error bars indicating SEM; # indicates difference following epinephrine alone from baseline value; + indicates difference in the phentolamine pretreatment group from their baseline value; * indicates difference between the two groups. Symbol number indicates significance: one symbol, P less than 0.05; two symbols, P less than 0.01; three symbols, P less than 0.001.

