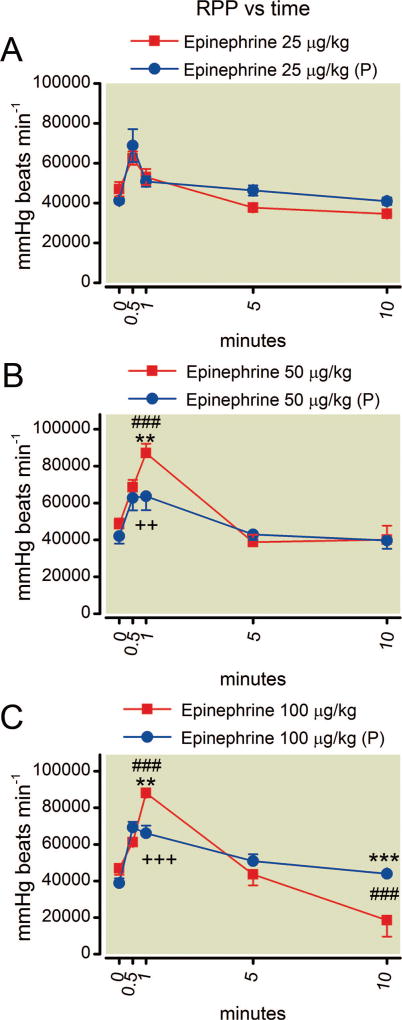
Fig. 6.
(A–C) Time course of rate pressure product (RPP) after epinephrine. The higher two doses increase RPP by 1 min but the value returns to baseline by 5 min. The highest dose of epinephrine results in a decreased rate pressure product by 10 min. Phentolamine pretreatment (P) protects against this effect. Mean values are plotted with error bars indicating SEM; # indicates difference following epinephrine alone from baseline value; + indicates difference in the phentolamine pretreatment group from their baseline value; * indicates difference between the two groups. Symbol number indicates significance: two symbols, P less than 0.01; three symbols, P less than 0.001.

