Fig. 3.
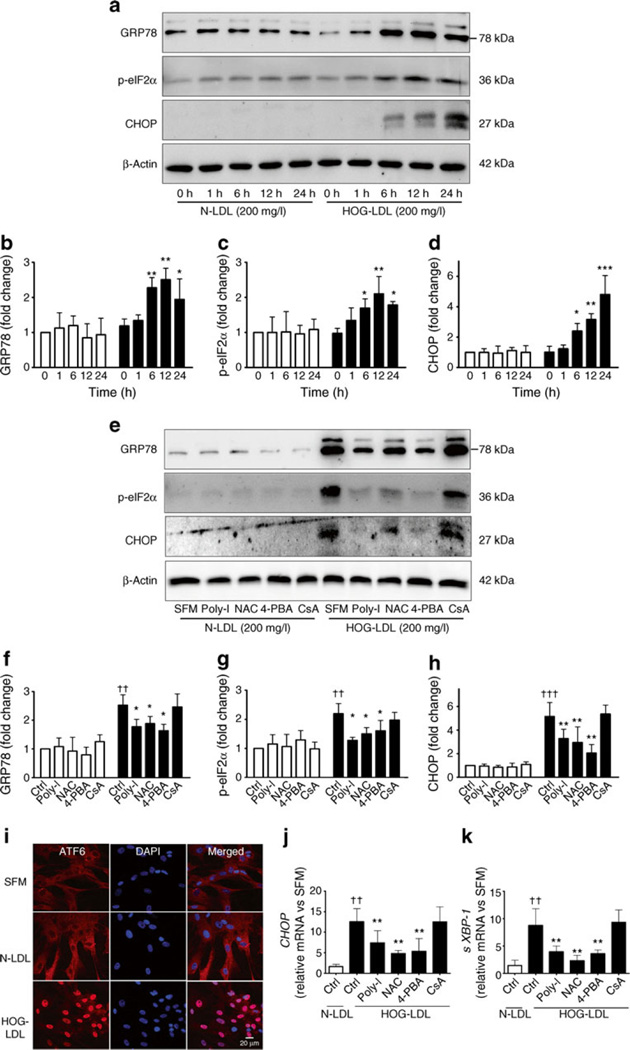
HOG-LDL activates ER stress in HRCP. (a) Time course of ER stress markers GRP78, p-eIF2α and CHOP in HRCP. Cells were treated as above (Fig. 2b). (b) Quantification of blot for GRP78, (c) p-eIF2α and (d) CHOP, expressed as means ± SD; n=3; *p<0.05, **p<0.01 and ***p<0.001 vs HOG-LDL at 0 h. White bars, N-LDL; black bars, HOG-LDL. (e) Poly-I, NAC and 4-PBA, but not CsA, inhibit HOG-LDL-activated ER stress in HRCP. Cells were treated for 12 h as above (Fig. 2f), and protein levels detected by western blot and quantified for (f) GRP78, (g) p-eIF2α and (h) CHOP. Values are mean ± SD; n=3; *p<0.05 and **p<0.01 vs HOG-LDL control; ††p<0.01 and †††p<0.001 vs N-LDL control. (i) Immunocytochemistry images showing nuclear translocation of ATF6 in HRCP. Cells were treated with N-LDL or HOG-LDL (200 mg/l) for 12 h. Data are representative of three separate experiments and show that HOG-LDL, but not N-LDL induced ATF6 translocation from cytoplasm to nucleus. (j, k) mRNA expression in HRCP. Real-time PCR documented mRNA expression for CHOP (j) and sXBP-1 (k) in HRCP treated for 12 h with N-LDL or HOG-LDL (200 mg/l) following pre-incubation (1 h) with or without Poly-I, NAC, 4-PBA and CsA. Relative mRNA levels were normalised to 18 s mRNA. Values are means ± SD; n=3; **p<0.01 vs HOG-LDL control; ††p<0.01 vs N-LDL control

