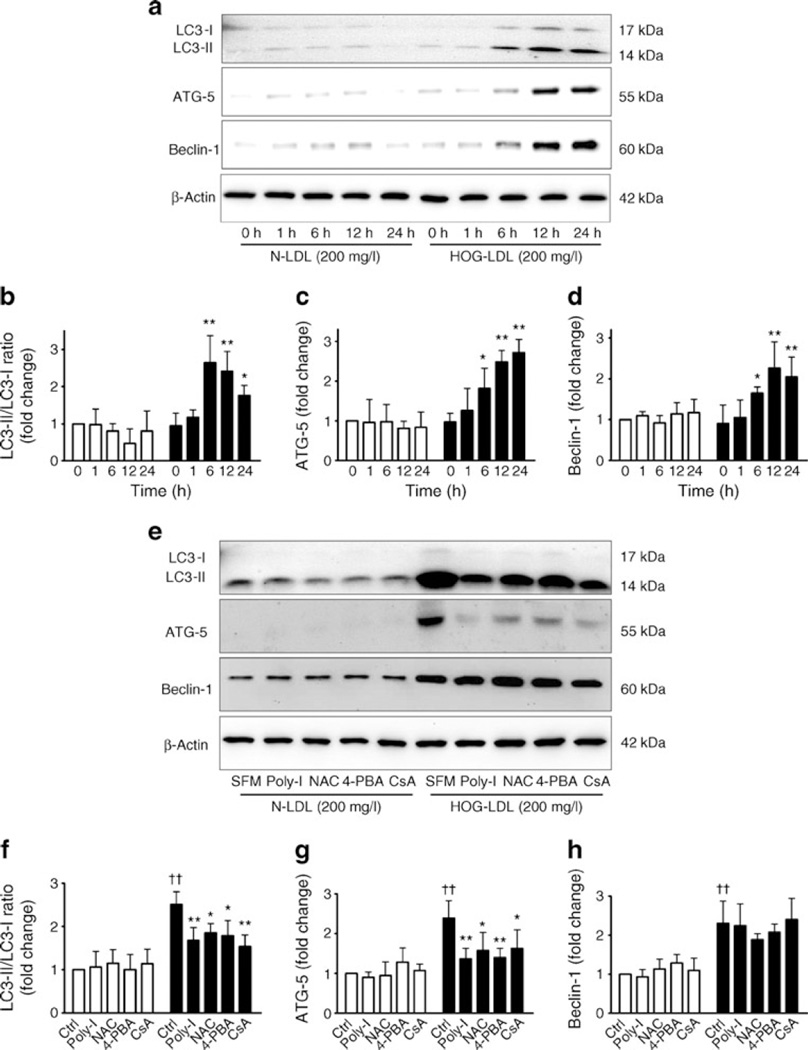
Fig. 6.
HOG-LDL induces autophagy in HRCP. (a) Time course of conversion of LC3-I to LC3-II, and of ATG5 and beclin-1 abundance in HRCP. Cells were treated as above (Fig. 2b) and western blot performed on total protein extracts, with β-actin used as loading control. (b) Quantification of findings for LC3-I to LC3-II, (c) ATG5 and (d) beclin-1, expressed as means ± SD; n=3; *p<0.05 and **p<0.01 vs HOG-LDL 0 h. White bars, N-LDL; black bars, HOG-LDL. (e) Poly-I, NAC, 4-PBA and CsA inhibit HOG-LDL-induced autophagy in HRCP. Cells were treated for 24 h as shown, and protein conversion and abundance as indicated detected by western blot. (f) Quantification of findings for LC3-II/LC3-I ratio, (g) ATG5 and (h) beclin-1, expressed as means ± SD; n=3; *p<0.05 and **p<0.01 vs HOG-LDL control; ††p<0.01 vs N-LDL control

