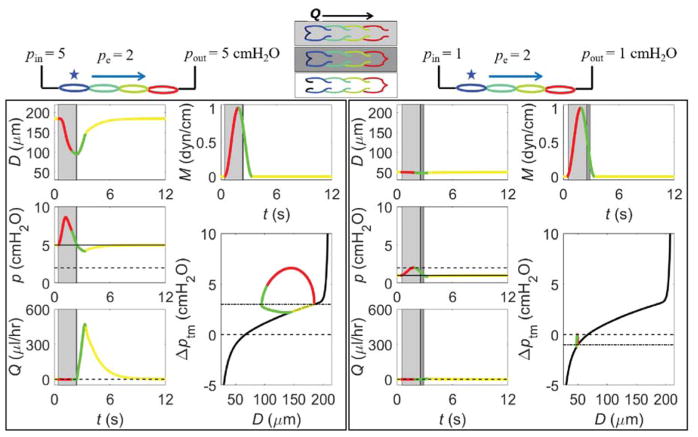
Figure 8.
Lumped-parameter modelling simulations of pumping by a chain of lymphangions contracting synchronously in the presence of positive (left) and negative (right) transmural pressure. D = diameter of the first lymphangion (indicated by star, at top), p = intra-lymphangion pressure, Q = flow-rate through the first valve in the chain, M = contraction activation, Δptm = transmural pressure, t = time. Pumping is initiated as shown in the curve of M(t) by lymphatic muscle activation (red), followed by relaxation (green) and inactivation (yellow). These colours are then used in the other panels to indicate timing. Suction occurs just after 170 seconds, when the pressure inside the lymphangion dips below the inlet pressure pa, after which the flow-rate through the first valve peaks. The loops of Δptm vs. D illustrate the time-course alongside the passive behaviour of the lymphangion (black), with the area of the loop defining the output work, and change in diameter indicating the flow-rate generated. In the presence of a negative transmural pressure (right), the Δptm-D loop is so small as to be barely visible, indicating pumping failure. Animations available in the on-line version.

