
Fig. 6.
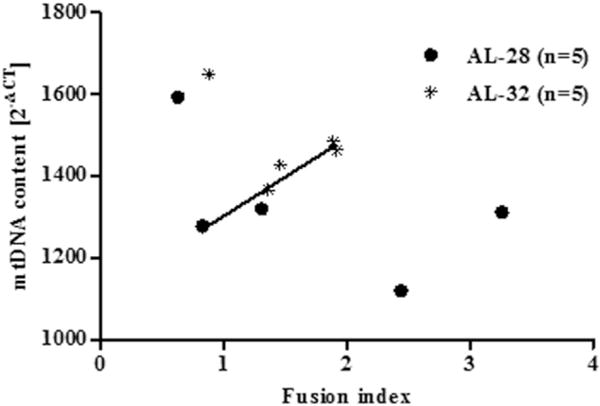
Correlation between the value of fusion index and the mtDNA content. A strong positive correlation was found between the fusion index value and the mtDNA content in four out of five animals from the AL-32 group and two from the AL-28 rats (see Table 2 for individual fusion indexes). The RT-PCR quantification of the mtDNA content in AL-28 and AL-32 rats, all normalized to β-actin, was performed according to the Pfaffl mathematical model and the values resulted from the calculation of the formula 2−ΔCT (Pfaffl 2001). Pearson’s test was performed and demonstrated a highly significant correlation (p < 0.005, correlation coefficient: 0.8931) in the AL-32 group (n = 4,) and AL-28 rats (n = 2) (filled line). The outlier from the AL-32 group and one animal from the AL-28 group shared the lowest fusion indexes together with the highest mtDNA contents, whereas the AL-28 rats with the highest fusion indexes were characterized by quite low mtDNA contents.