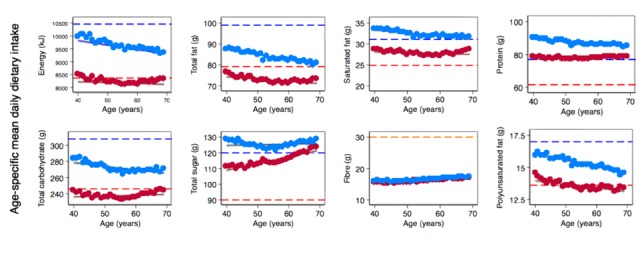
Figure 1.

Energy (kJ) and macronutrient (g) intakes per year of age by sex. The points represent the age-specific mean daily dietary intake (blue for men, red for women) at different ages. The dashed lines represent the recommended daily intake (blue for men, red for women, orange for men and women). The solid lines represent the linear model relating dietary intake to age (blue for men, red for women).
