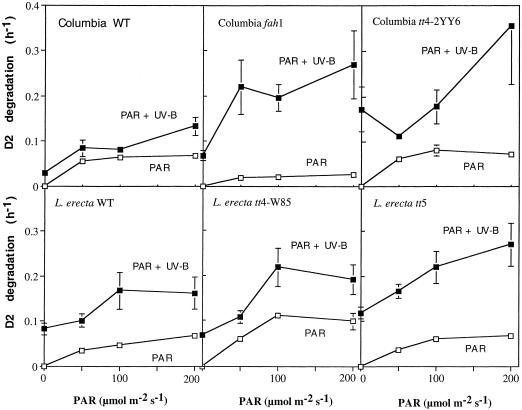
Figure 3.
D2 protein degradation in Arabidopsis Columbia and Landsberg ecotypes, and in mutants fah1, tt4–2YY6, tt4-W85, and tt5. Leaves were pulse-labeled and chased as described in the legend to Figure 1. Leaves were exposed to the PAR fluence indicated, in the presence (0.62 μmol m−2 s−1) or absence of a background of UV-B radiation. Values represent averages of data from several independent experiments (n = 4–8). se of the mean are shown.

