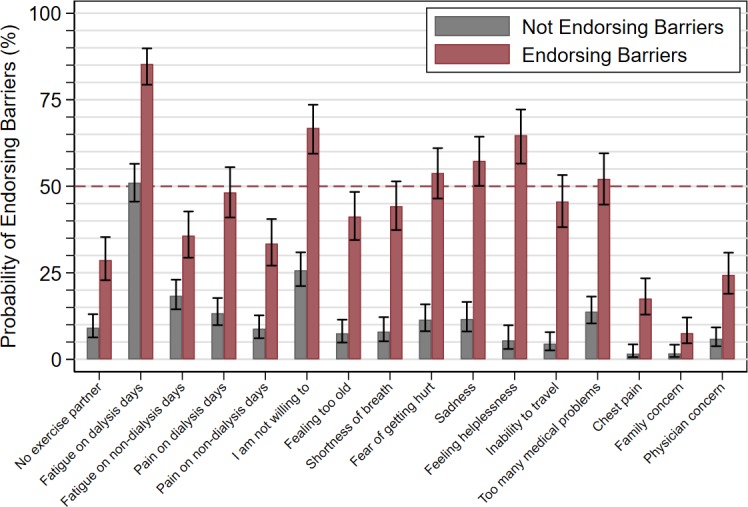
Fig 2. Probability of endorsing barriers to physical activity according to the categorization of hemodialysis patients into “endorsing barriers” and “not endorsing barriers” according to latent class analysis.

Bar charts depict predicted values and 95% confidence intervals for the probability of endorsing a given barrier to physical activity, if the patient belongs to the class of “Endorsing barriers” (red bars) or to the class of “Not endorsing barriers” (gray bars). The horizontal dashed line represents 50% probability. It can be seen that the “Endorsing barriers” class was associated with a high (>50%) predicted probability of endorsing a number of barriers. For instance, if the patient is a barrier endorser, then the probability of endorsing "Sadness", and "Feeling helpless" is significantly greater than 50% (i.e., the 95% confidence intervals do not cross the dashed line); if the patient is not a barrier endorser, then the probability of endorsing "Sadness", and "Feeling helpless" is low.
