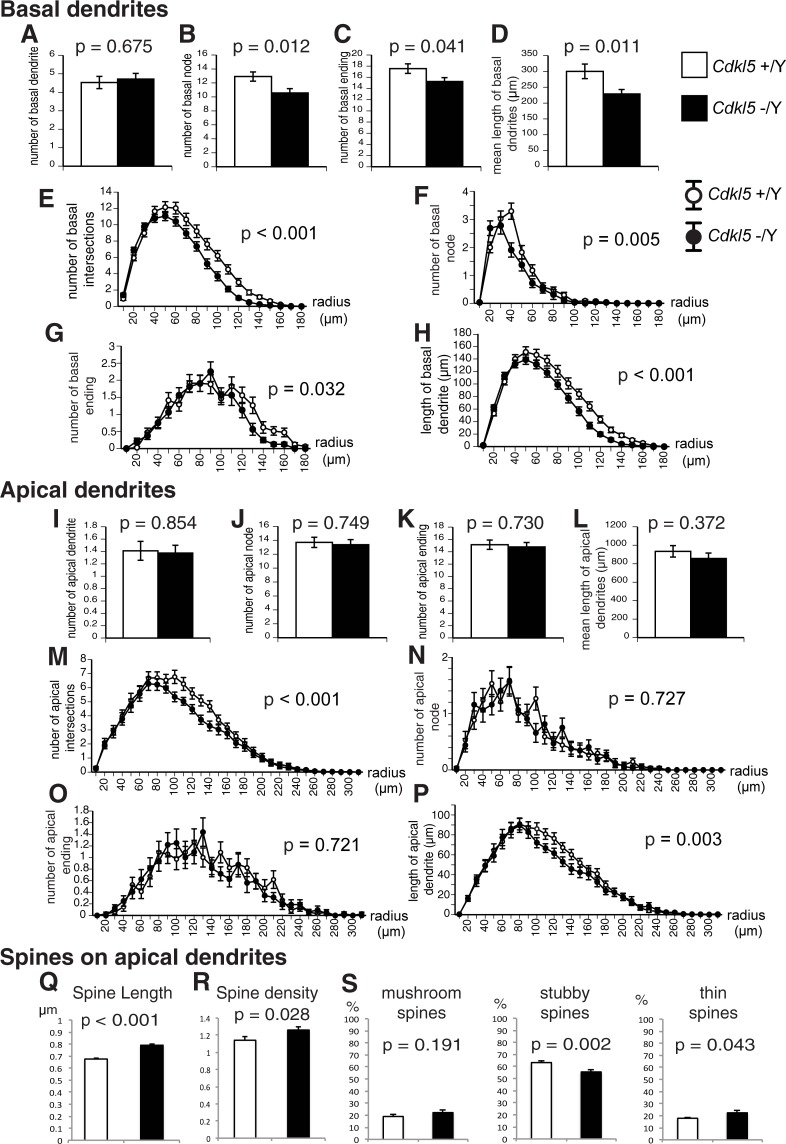
Fig 9. Dendritic arborization and spine geometry of hippocampal CA1 pyramidal neurons are impaired in Cdkl5 -/Y mice.
Results for basal dendrites (A-H) and apical dendrites (I-P). Cdkl5 +/Y, n = 34 neurons; Cdkl5 -/Y, n = 32 neurons. Bar graphs (A-D, I-L) show overall mean values, and line graphs (E-H, M-P) show mean values on 10-μm increment concentric circles. There are no significant differences in the mean numbers of basal and apical dendrites between two genotypes (A,I). The number of nodes (B,F), endings (C,G), intersections (E), and length (D,H) of basal dendrites are significantly decreased in Cdkl5 -/Y mice. The numbers of intersections (M) and length (P) of apical dendrites are significantly decreased in Cdkl5 -/Y mice. (Q,R) Morphometric analysis of spines on apical dendrites. Cdkl5 +/Y, 8,150 spines, n = 29 neurons; -/Y, 6,831 spines, n = 32 neurons. The mean length (Q) and density (R) are increased in Cdkl5 -/Y mice. (S) Spine-type classification analysis. Cdkl5 +/Y, 3,442 spines, n = 15 neurons; -/Y, 4,294 spines, n = 15 neurons. Cdkl5 -/Y mice show a significantly lower percentage of stubby spines and a significantly higher percentage of thin spines. (A-D, I-L) are analyzed by ANOVA, (E-H, M-P) are analyzed by repeated measure ANOVA, and (Q-S) are analyzed by Student’s t-test. Data indicate mean ± SEM.

