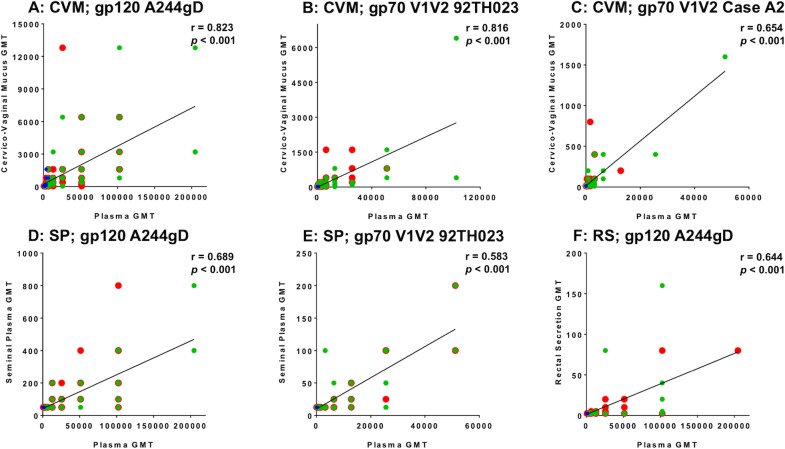
Fig 6. Correlation of IgG responses in anogenital secretions and plasma.
Spearman’s rank correlations of IgG responses for gp120 A244gD (CRF01_AE), gp70V1V2 92TH023 (CRF01_AE) and gp70V1 V2 Case A2 (subtype B) at weeks 2, 26, 48 and 72 in matched CVM (A-C), SP (D-E) and RS (F), and plasma of RV305 vaccine recipients are shown. Each group is color coded; red, ALVAC-HIV/AIDSVAX®B/E; green, AIDSVAX®B/E; blue, ALVAC-HIV. Numeric values above each plot depict r- and p-values. Significant p-value <0.05, GMT = Geometric Mean Titer.

