Fig. 1.

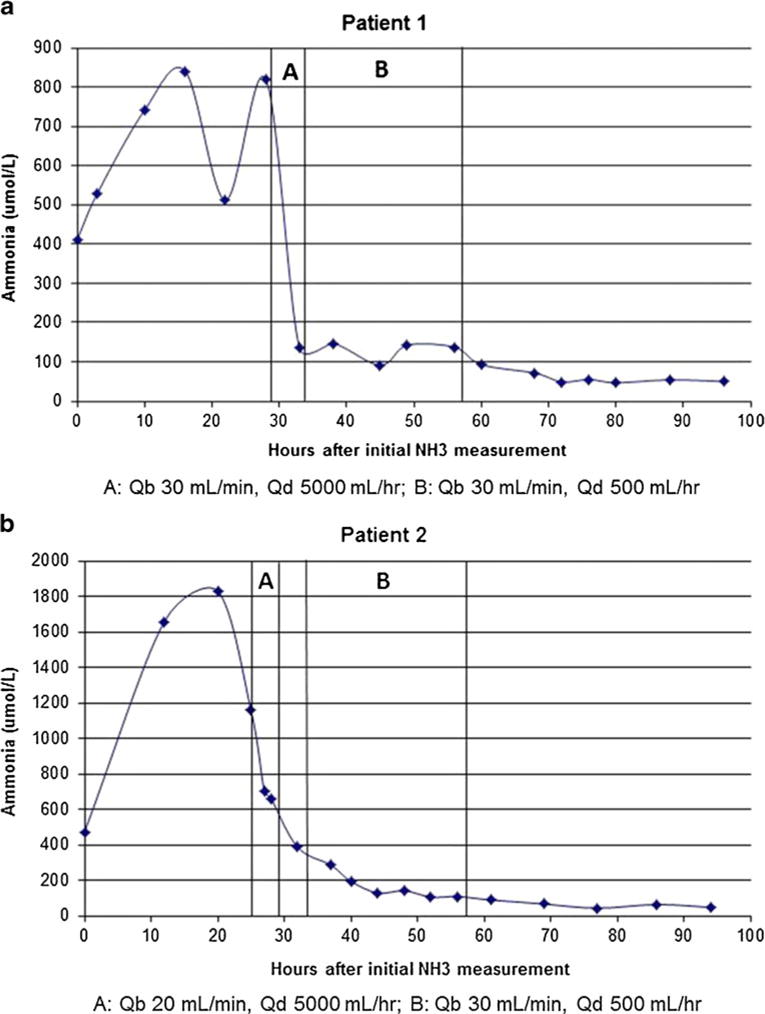
a, b Ammonia levels over time are shown for both patients. Patient 2 was off dialysis for approximately 3 h, represented in b as the time between the second and third bars. Qb Blood flow rate, Qd dialysate flow rate

a, b Ammonia levels over time are shown for both patients. Patient 2 was off dialysis for approximately 3 h, represented in b as the time between the second and third bars. Qb Blood flow rate, Qd dialysate flow rate