Figure 4.
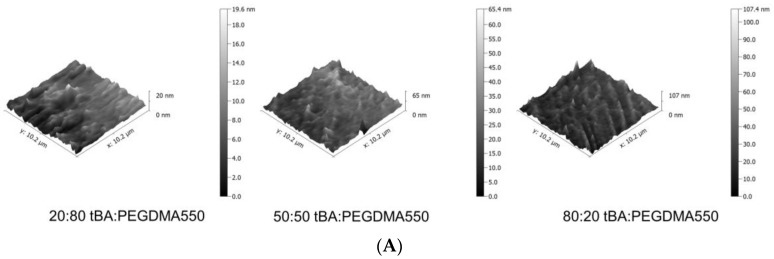
(A) Representative Atomic Force Microscopy (AFM) images of tBA:PEGDMA550 samples. 3D AFM images depict increases in surface roughness as tBA increases. tBA:PEGDMA750 and tBA:PEGDMA1000 AFM images follow a similar trend; (B) Root mean square roughness (Rq) of tBA:PEGDMA550; (C) Root mean square roughness (Rq) of tBA:PEGDMA750; (D) Root mean square roughness (Rq) of tBA:PEGDMA1000. Root mean square roughness (Rq) generally increases with increasing tBA content and increasing PEGDMA MW. Significance was determined using one-way ANOVA to determine significant differences between samples of a given crosslinker in addition to the Tukey’s Honest Significance Difference Procedure between individual samples. * corresponds to p < 0.05, ** corresponds to p < 0.01, *** corresponds to p < 0.001.


