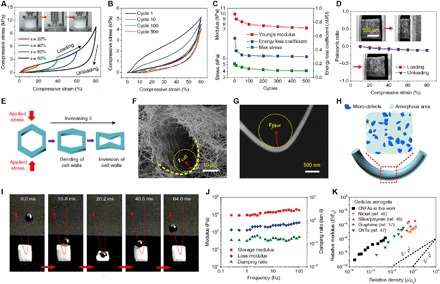
Fig. 2. Multicycle compressive properties of the CNFAs.

(A) Compressive σ versus ε curves during loading-unloading cycles with increasing ε amplitude. (B) A 500-cycle fatigue test with compressive ε of 60%. (C) Young’s modulus, energy loss coefficient, and maximum stress versus compressive cycles. (D) The Poisson’s ratio of the CNFAs versus ε. Inset: SEM observations of the CNFAs under compression and release, focusing on a small piece (<1 mm). (E) Sketch of the inversion of the nanofibrous cell walls under compression. SEM images showing the curvature radius of (F) a single cellular cell and (G) a single nanofiber. (H) Schematic illustration of the microstructure of a bent silica nanofiber. (I) A set of real-time images showing that CNFAs can rebound a steel ball at high speed. (J) The frequency dependence of the storage modulus, loss modulus, and damping ratio for CNFAs (oscillatory ε of 3%). (K) The relative Young’s modulus of selected cellular aerogels with low densities.
