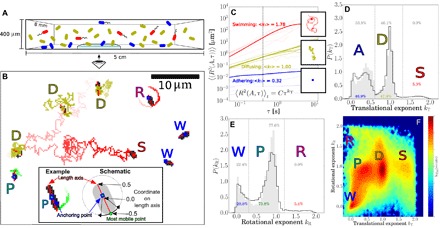
Fig. 1. Tracking and classification of bacteria.

(A) Schematic of adhering (blue), diffusing (olive), and swimming (red) bacteria in a capillary. (B) Trajectories tracing the most mobile point on a cell. Straight red lines are fits of the length axis, squares mark anchoring points, and letters mark the type: diffuser (D), swimmer (S), wobbler (W), pivoter (P), and active rotator (R). The image is black/white-inverted and thresholded to be clear in print. Inset: Adhering cell and schematic depicting the anchoring coordinate and most mobile coordinate ∈ [−0.5, 0.5] on its length axis. (C) MSDs as a function of time interval τ from trajectories of swimming (red), diffusing (olive), and adhering (blue) bacteria; thin lines show randomly selected individual trajectories and thick lines represent the average 〈R2(A, τ)〉i,t of each category. The insets show an example trajectory for each category; squares denote the position in the last frame. (D) Normalized distribution of the translational exponent kT for WT cells on glass during the first 2 hours of the experiment, showing distinct peaks for adhering (A), diffusing (D), and swimming (S) subpopulations. (E) Normalized distribution of the rotational exponent kR for adhering cells, showing three peaks for wobblers (W), pivoters (P), and active rotators (R). Data in in panels D and E for the nonflagellated mutant ΔFF are shown in gray. (F) Two-dimensional histogram (logarithmic scaling) of the translational (kT) and rotational (kR) exponents for WT cells, showing three peaks for adherers (W, P, and R), one for diffusers (D), and one for swimmers (S). The distributions in panels D to F are based on 139,335 cells for WT and 10,582 cells for ΔFF, and data are weighted for trajectory durations.
