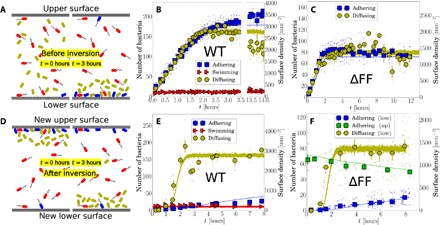
Fig. 2. Capillary inversion assay.

(A) Schematic of adhering (blue), diffusing (olive), and swimming (red) cells in the capillary at loading (0 hours) and 3 hours after, when nonmotile cells have sedimented, and motile cells have reached the top and bottom surfaces. (B) Number of adherers, diffusers, and swimmers on the lower surface as a function of time for WT and (C) for ΔFF. (D) Schematic immediately (0 hours) and 3 hours after capillary inversion. (E) Number of cells on the lower surface after inversion for WT and (F) for ΔFF, where the number of adhering cells on the upper surface is also given. Small points are average values for single movies, and large points are weighted averages over groups of multiple movies, with vertical bars as the SE and horizontal bars as the time window for each point. The lines in panels B, C, E, and F are results from simulations with a minimal kinetic model.
