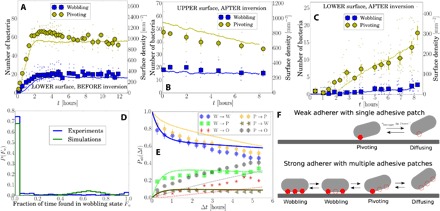
Fig. 3. Polydispersity in adhering cells for ΔFF.

(A) Number of wobbling and pivoting cells on the lower surface before capillary inversion and (B and C) on the upper and lower surface after capillary inversion. Solid lines in panels A to C are from simulations with a minimal kinetic model. Data correspond to the inversion experiments in Fig. 2 (C and F). (D) Histogram showing the fraction of time cells are identified as wobbling on the lower surface before inversion, as in experiments (from a total of 117 movies over six different positions recorded between 4 and 12 hours before capillary inversion) and simulations. (E) Probabilities for a cell in a wobbling (W) or pivoting (P) state at time t to be found wobbling, pivoting, or off the surface (O) at a later time t + Δt (lines are for the kinetic model). (F) Schematic of weakly and strongly adhering cells: filled red circle, bound adhesive patch; empty circles, unbound adhesive patch.
