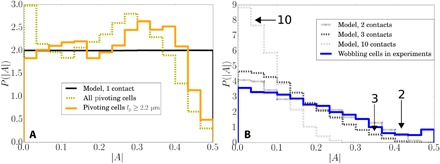
Fig. 4. Distributions of anchoring coordinates for ΔFF.

(A) The measured distribution of anchoring coordinates |A| for all pivoting cells (olive, 11,359 cells), only pivoting cells with lP > 2.2 μm (orange, 4338 cells) and for modeled cells with one contact point (black line). (B) The measured distribution of wobbling cells (blue, 4099 cells) fits best with models of cells with two or three patches. Modeled distribution of cells with 10 patches is also shown and peaks sharply close to zero. Modeled wobbler distributions were calculated using the P(|A|) for pivoters with artifacts removed.
