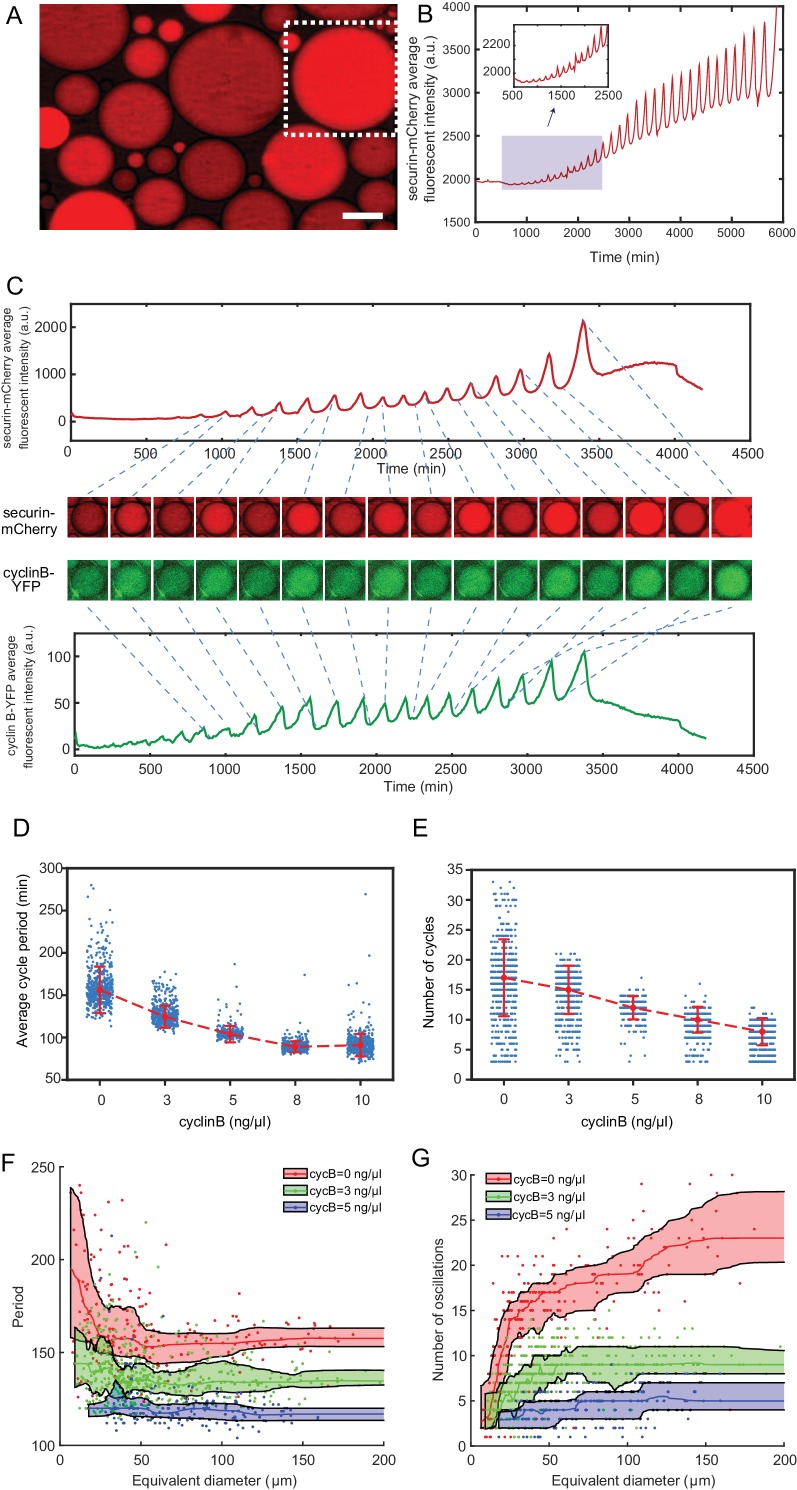
Figure 2. The minimal cell cycle oscillator is robust and tunable.
(A) Fluorescence image of securin-mCherry, a reporter for the cell cycle oscillator, in micro-emulsion droplets (scale bar, 100 µm). One example droplet (inside the white dotted framed square) is selected for time course analysis in Figure 2B. (B) The time course of securin-mCherry fluorescence intensity of the selected droplet from Figure 2A, indicating 32 undamped oscillations over a course of 100 hr. (C) Simultaneous measurements of fluorescence intensities of securin-mCherry (upper panel) and cyclin B-YFP (lower panel), showing sustained oscillations for about 58 hr. The mRNA concentrations of securin-mCherry and cyclin B-YFP are 10 ng/µL and 1 ng/µL. The series of mCherry and YFP images correspond to selected peaks and troughs in the time courses of fluorescence intensities. The two channels have coincident peaks and troughs for all cycles, suggesting that they both are reliable reporters for the cell cycle oscillator. (D, E) The oscillator is tunable in frequency (D) and number of cycles (E) as a function of the concentration of cyclin B mRNAs. Cyclin B not only functions as a substrate of APC/C but also binds to Cdk1 for its activation, functioning as an ‘input’ of the clock. In Figure 2D, the cell cycle periods are shortened by increasing the mRNA concentrations. In Figure 2E, the number of total cell cycles is reduced in response to increasing cyclin B mRNA concentrations. Each data point represents a single droplet that was collected from one of the loading replicates (see Materials and methods 7). Red dashed line connects medians at different conditions. Error bar indicates median absolute deviation (MAD). (F, G) Droplets with smaller diameters have larger periods on average and a wider distribution of periods (F), and exhibit smaller number of oscillations on average (G). Colored areas represent moving 25 percentiles to 75 percentiles and is smoothed using the LOWESS smoothing method (see Materials and methods 7). The equivalent diameter is defined as the diameter of a sphere that has an equal volume to that of a droplet, estimated by a volume formula in literature (Good et al., 2013). Note that these size effects are smaller for droplets with higher cyclin B mRNA concentrations.

