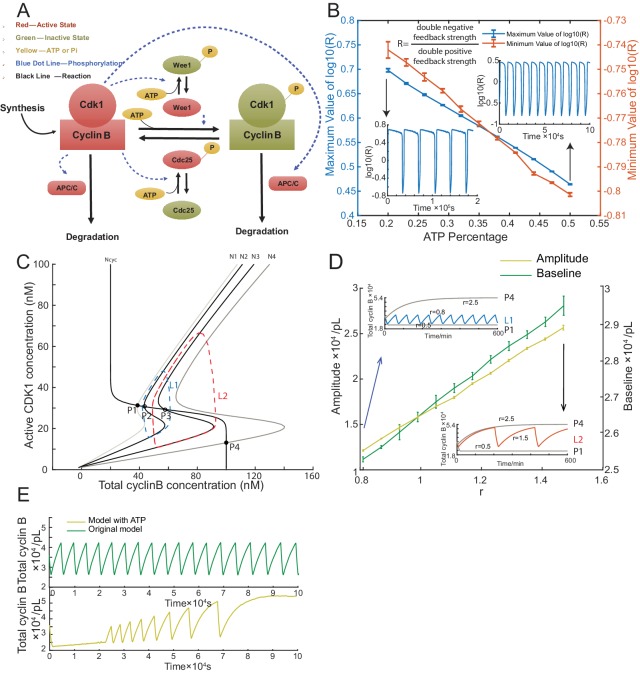
Figure 3. Simulation of cell cycle model with energy depletion.
(A) Schematic view of the cyclin B-Cdk1 oscillation system. Note that ATP is taken into consideration. Activated molecules are marked in red, inactivated molecules in green and ATP or Pi in yellow. Black line indicates a reaction and blue dotted line a phosphorylation. (B) Relationship between ATP percentage and R value, showing that decreasing the ATP concentration leads to a higher R value. Error bars represent ranges from three simulations. Two inserts represent the dynamics of R value over time when the ATP percentage [ATP]/([ATP]+[ADP]) is set as 0.2 (left) and 0.5 (right). The model is simulated using Gillespie algorithm. (C) Phase plots of the two-ODE model. Parameters for the cyclin B nullcline (Ncyc) (Yang and Ferrell, 2013) and the Cdk1 nullclines with a variety of values of r (N1, r = 0.5; N2, r = 0.8; N3, r = 1.5; N4, r = 2.5) were chosen based on previous experimental work (Pomerening et al., 2003; Sha et al., 2003). Note that the r here is a parameter and is different from R in Figure 3B. Two sample traces of limit cycle oscillations are plotted for r = 0.8 (L1) and r = 1.5 (L2), showing that a larger r value leads to a higher amplitude and baseline. In addition, r = 0.5 (N1) generates a low stable steady-state of cyclin B (P1), while r = 2.5 (N4) a high stable steady-state of cyclin B (P4). These stable steady-states are indicated by the intersections of the nullclines (filled circles). The unstable steady states are labeled with open circles (P2 and P3). (D) Relationship between the oscillation baseline and amplitude values and ATP concentration (positively correlated with r). Error bars indicate the ranges of 3 replicates. Inserts show two example time courses of total cyclin B with different r values (L1, r = 0.8; L2, r = 1.5), colors of which match the ones in Figure 3C. Simulation is done using Gillespie algorithm. (E) Time series of total cyclin B molecules from the model without ATP (top panel, green line) and with ATP (bottom panel, yellow line).


