. 2018 Mar 9;7:e32110. doi: 10.7554/eLife.32110

Figure 3. Genes with fitness defects on fatty acids.

(A) Heatmap of fitness scores for R. toruloides genes with predicted roles in beta-oxidation of fatty acids. Enzyme classes and predicted locations were inferred from homologous proteins in Ustilago maydis as reported by Camões et al. (Camões et al., 2015). See Supplementary file 2 for full fitness data. (B) Logoptical density ratio for single deletion mutants versus the YKU70∆ control strain at mid-log phase on 1% oleic acid as carbon source are plotted against the fitness scores for each gene from BarSeq experiments on 1% oleic acid. (C) Logoptical density ratio for single deletion mutants versus the YKU70∆ control strain at mid-log phase on 1% ricinoleic acid as carbon source are plotted against the fitness scores for mutants in each gene from BarSeq experiments on 1% ricinoleic acid. See Supplementary file 2 for a statistical summary for all strains shown in (B) and (C), including P values and effect sizes. The following figure supplements are available for Figure 3.
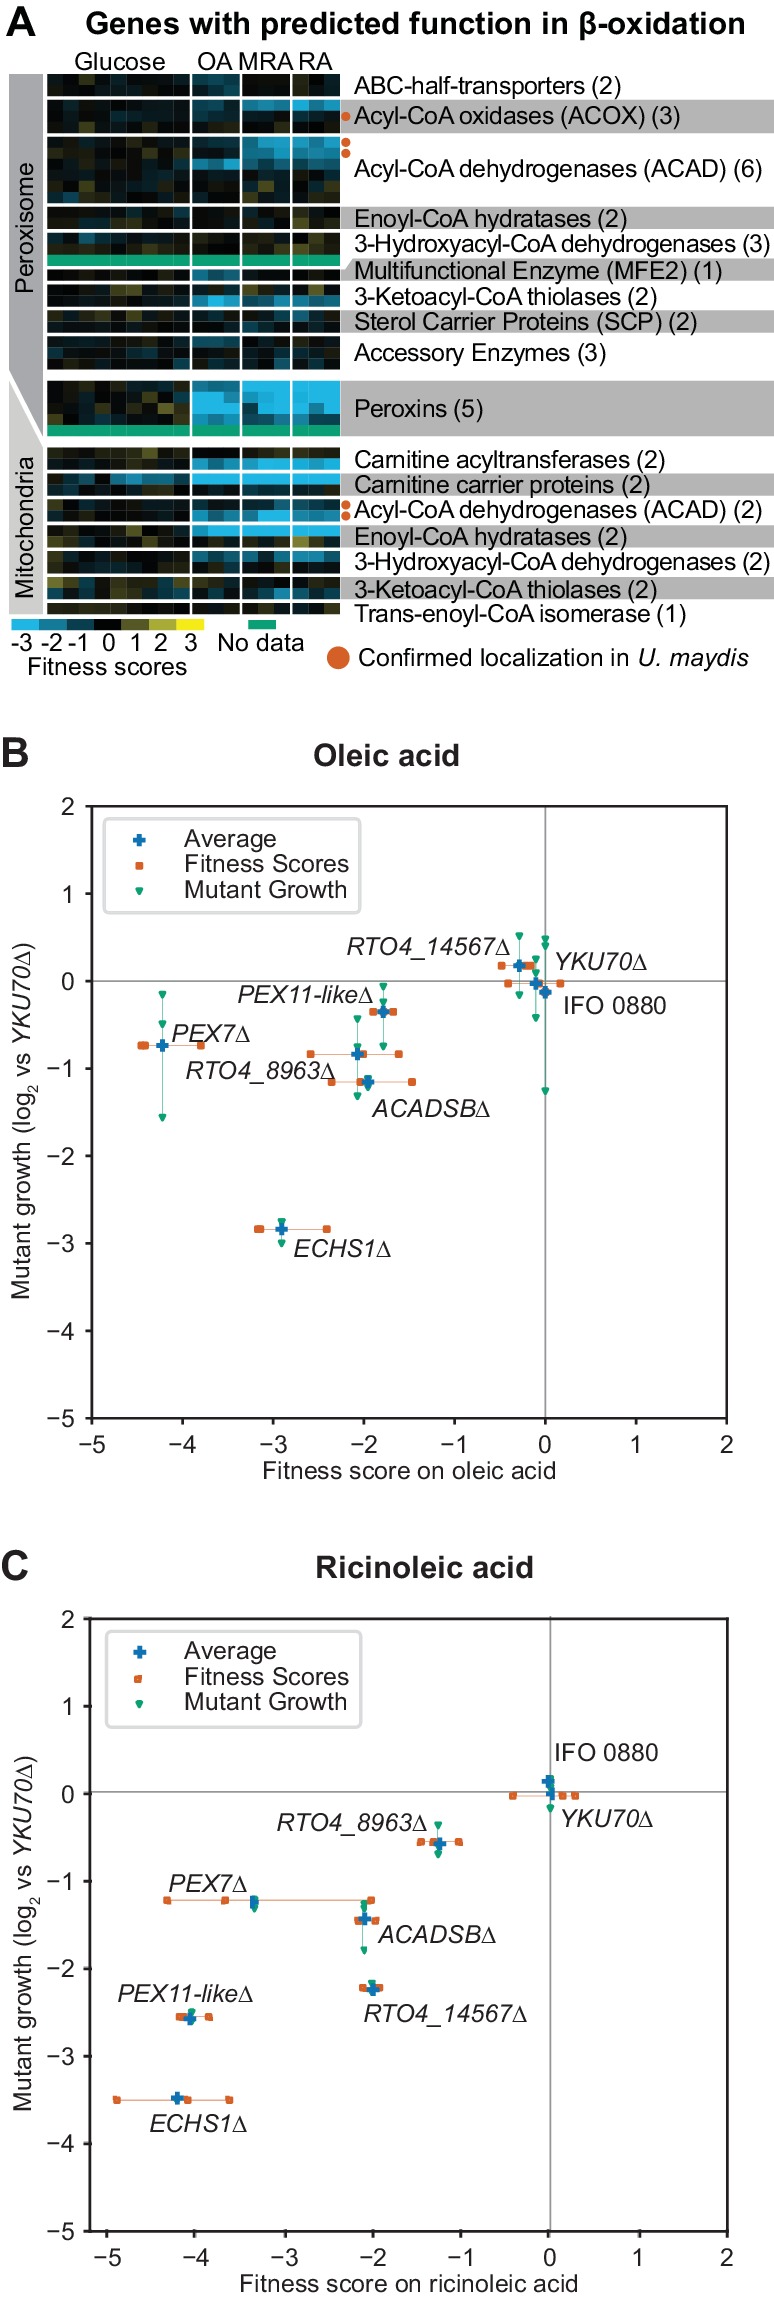
Figure 3.

Figure 3—figure supplement 1. K-means clusters of fitness scores for 129 genes for which mutants have specific fitness defects on fatty acids.
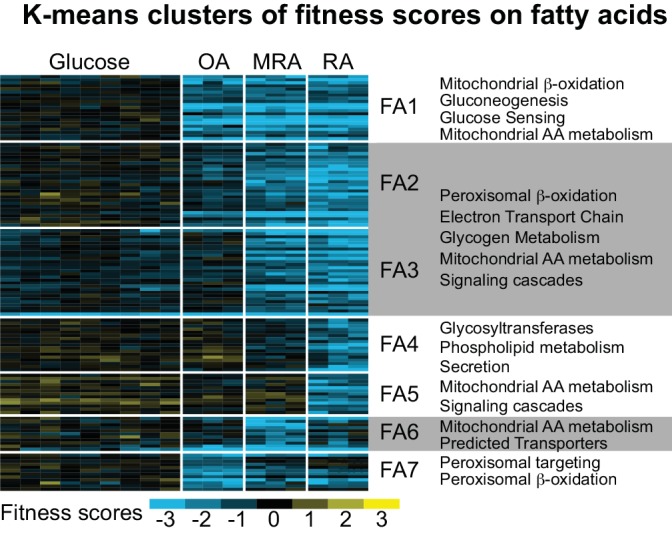
Figure 3—figure supplement 1.

Fitness scores for individual biological replicates were clustered in this analysis (six replicates on glucose, three for each fatty acid). OA: oleic acid, RA: ricinoleic acid, MRA: methyl ricinoleic acid. Seven clusters were identified based on carbon utilization patterns; FA1 - fitness defects on all fatty acids, FA2 and FA3 - fitness defects on MRA and RA, FA4 and FA5 – fitness defects on RA only, FA6 – fitness defects on MRA only, and FA7 – fitness defects on OA only. Major categories of predicted gene functions are summarized for the clusters. See Supplementary file 2 and 3 for full fitness data and gene ontology enrichments.
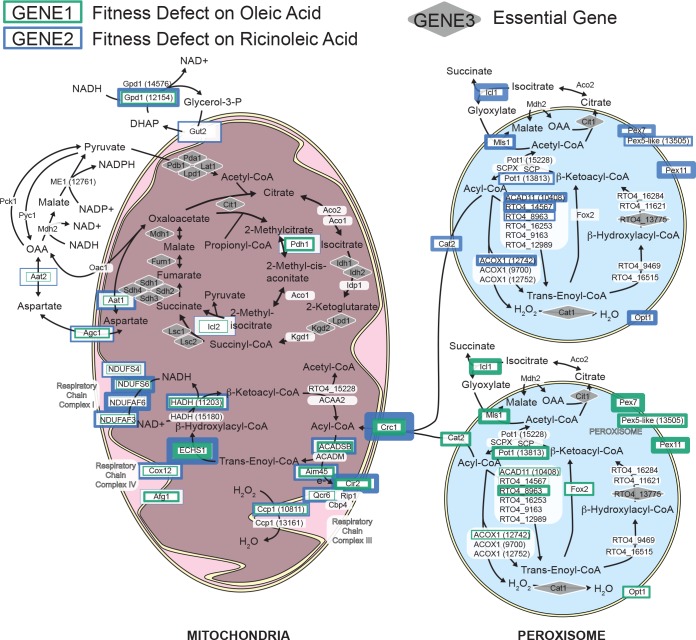
Figure 3—figure supplement 2. Model for beta-oxidation of fatty acids in Rtoruloides.

Figure 3—figure supplement 2.

Fitness scores for genes with predicted roles in mitochondrial and peroxisomal beta-oxidation are represented by the width of green or blue borders around each protein, with wider borders corresponding to lower fitness scores. Green and blue borders represent fitness on oleic and ricinoleic acid, respectively. Fitness scores on fatty acids were consistently most severe for a few genes predicted to mediate steps in mitochondrial beta-oxidation with little to no predicted redundancy in the R. toruloides genome. Fitness scores were more variable between different fatty acids for peroxisomal enzymes, for which more paralogs are present.
Figure 3—figure supplement 3. Extended growth curves for deletion mutants on fatty acids.
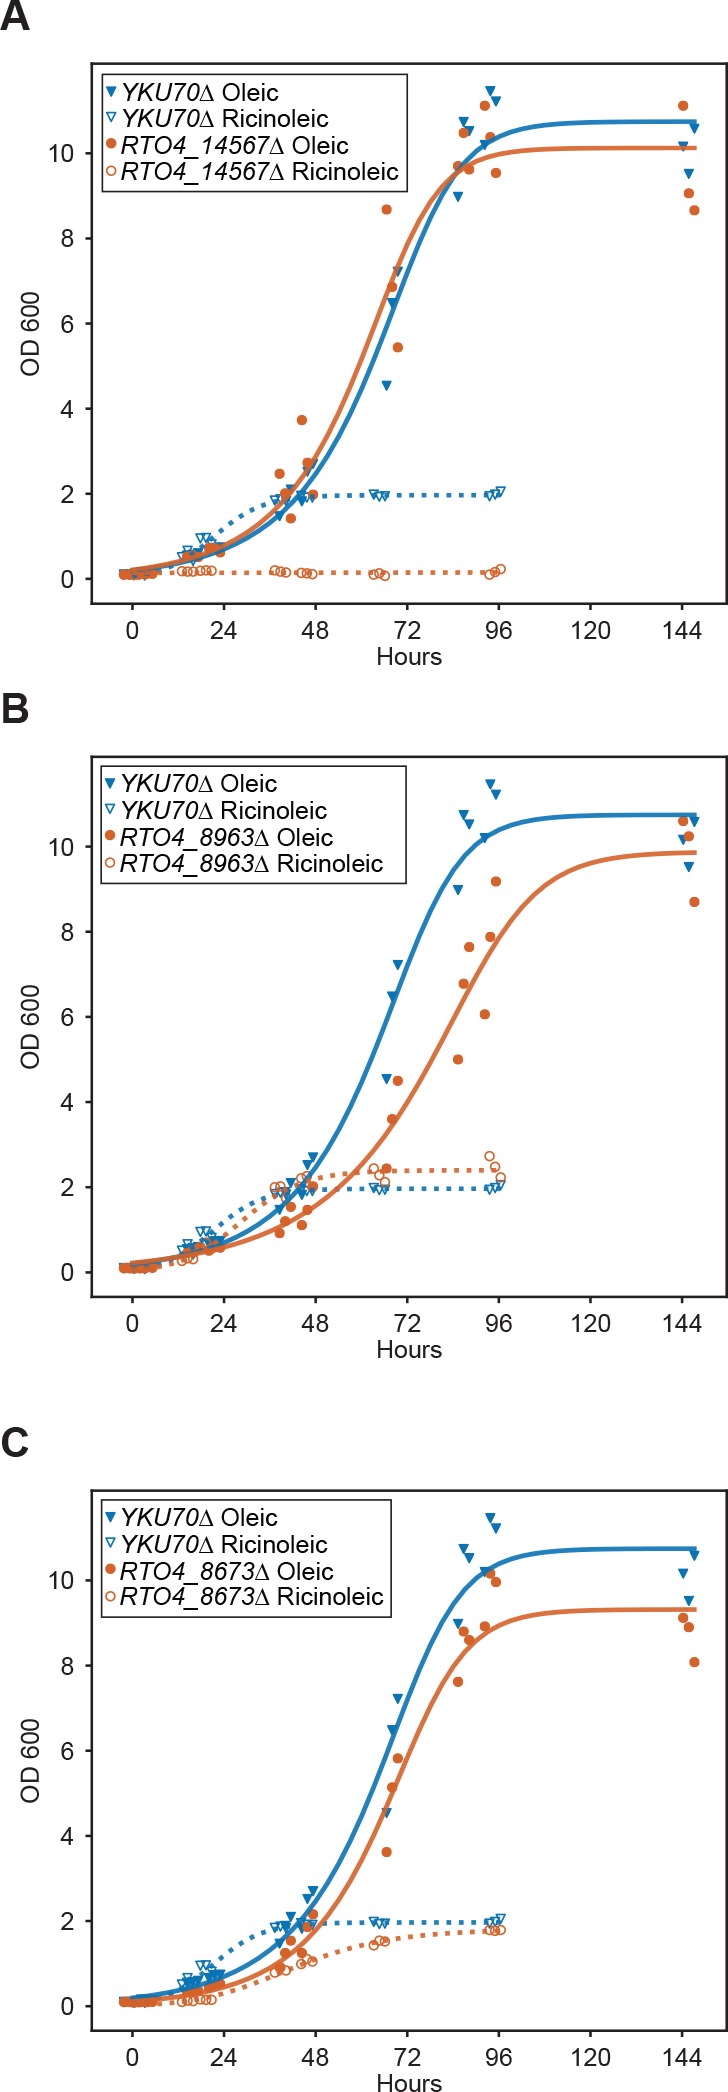
Figure 3—figure supplement 3.

Growth curves for deletion mutants of (A) RTO4_14567 (similar to H. sapiens ACAD11), (B) RTO4_8963 (similar to H. sapiens ACAD11), and (C) RTO4_8673 (similar to PEX11) on 1% oleic acid and 1% ricinoleic acid as the sole carbon source. See Supplementary file 2 for a statistical summary for all strains including P values and effect sizes.