Figure 5. RB-TDNAseq on enriched populations identifies genes affecting lipid accumulation.
(A) Hierarchical clusters of enrichment scores for 271 genes with consistent enrichment (|E| > 1, |T| > 3) in high/low fractions separated by buoyant density or FACS sorting of BODIPY stained cells after lipid accumulation on low nitrogen media. Enrichment scores for individual biological replicates (three per condition) were clustered in this analysis. Eight major clusters were identified (LA1-LA8). See Supplementary file 2 for full enrichment data. (B and C) Relative BODIPY signal for deletion mutants. Points are the average BODIPY/cell for 10,000 cells from independent biological replicate cultures normalized to three control YKU70∆ cultures processed on the same day. Three biological replicates were processed for each strain in any given experiment and each strain was included in at least two experiments processed on different days (N ≥ 6). A statistical summary for all strains including N, P values, and effect sizes is included in Supplementary file 2. **p<0.01, *p<0.05 by homoscedastic T-test versus YKU70∆. 1Human homolog, 2C. neoformans homolog, 3A. nidulans homolog. The following figure supplements are available for Figure 5.

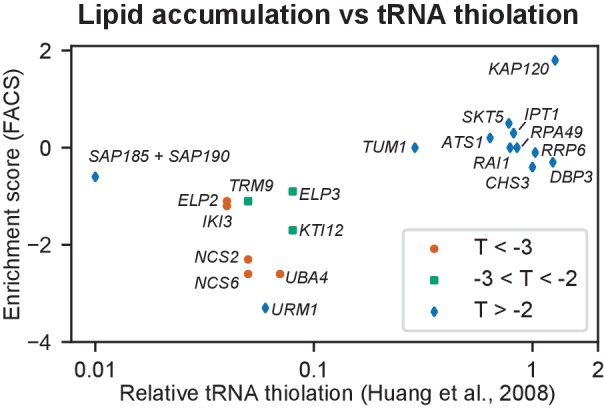
Figure 5—figure supplement 1. tRNA thiolation in S. cerevisiae versus lipid accumulation in R. toruloides.