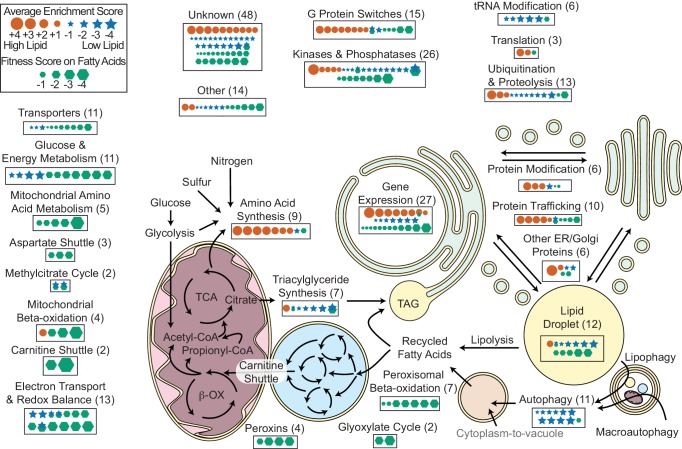
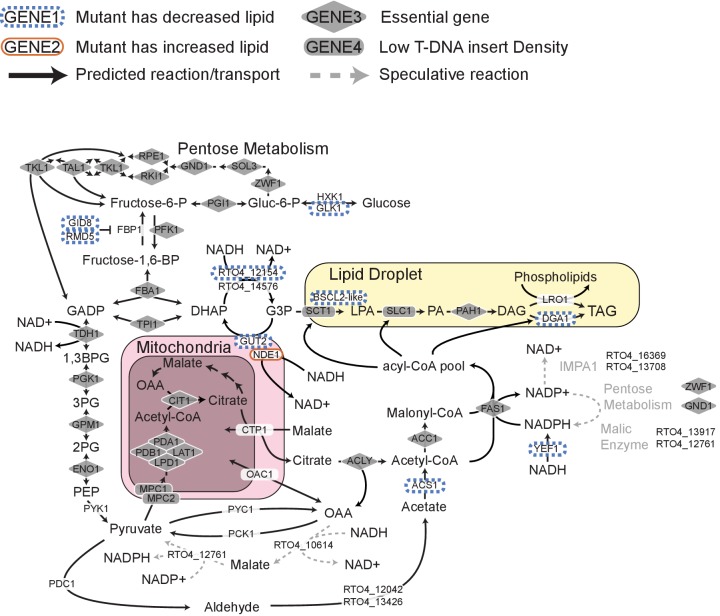
Figure 6. Overview of R. toruloides lipid metabolism.
Key metabolic pathways and cellular functions mediating lipid metabolism as identified from fitness scores on fatty acid and enrichment scores from lipid accumulation screens. Fitness and/or enrichment scores for individual genes are depicted graphically by relative size of hexagonal, circular or star icons respectively. Only fitness scores for genes with consistent growth defects on at least one fatty acid (see Supplementary file 2) and enrichment scores from high confidence clusters (see Figure 5 and Supplementary file 2) are shown. Enrichment scores were averaged between buoyancy and FACS experiments, except for genes with confounding enrichment scores in rich media conditions, for which only FACS data were averaged. Positive scores (orange circles) represent genes for which mutants have increased lipid accumulation. Negative fitness scores (blue stars) represent genes for which mutants have decreased lipid accumulation. Genes detected in proteomics of R. toruloides lipid droplets by Zhu et al. (RAC1, GUT2, PLIN1, EGH1, RIP1, MGL2, AAT1, CIR2, MLS1, and RTO4_8963) or found in lipid droplets of many organisms (DGA1 and BSCL2) (see Supplementary file 5) are depicted under ‘Lipid Droplet’ and also their molecular functions, e.g. ‘G Protein Switches’ for RAC1. The following figure supplements are available for Figure 6.


